Thelander IF Digest: May 2023
How Should You Customize Investment Firm Compensation Data?
In May’s Thelander Digest, we examine which factors make the biggest difference in investment firm compensation.
So, what filters really make a difference? The Thelander platform allows you to easily customize investment firm data by by four filters: total assets under management, size of most recent fund, type of firm, and region. Plus, the data is real-time and the tables are interactive.
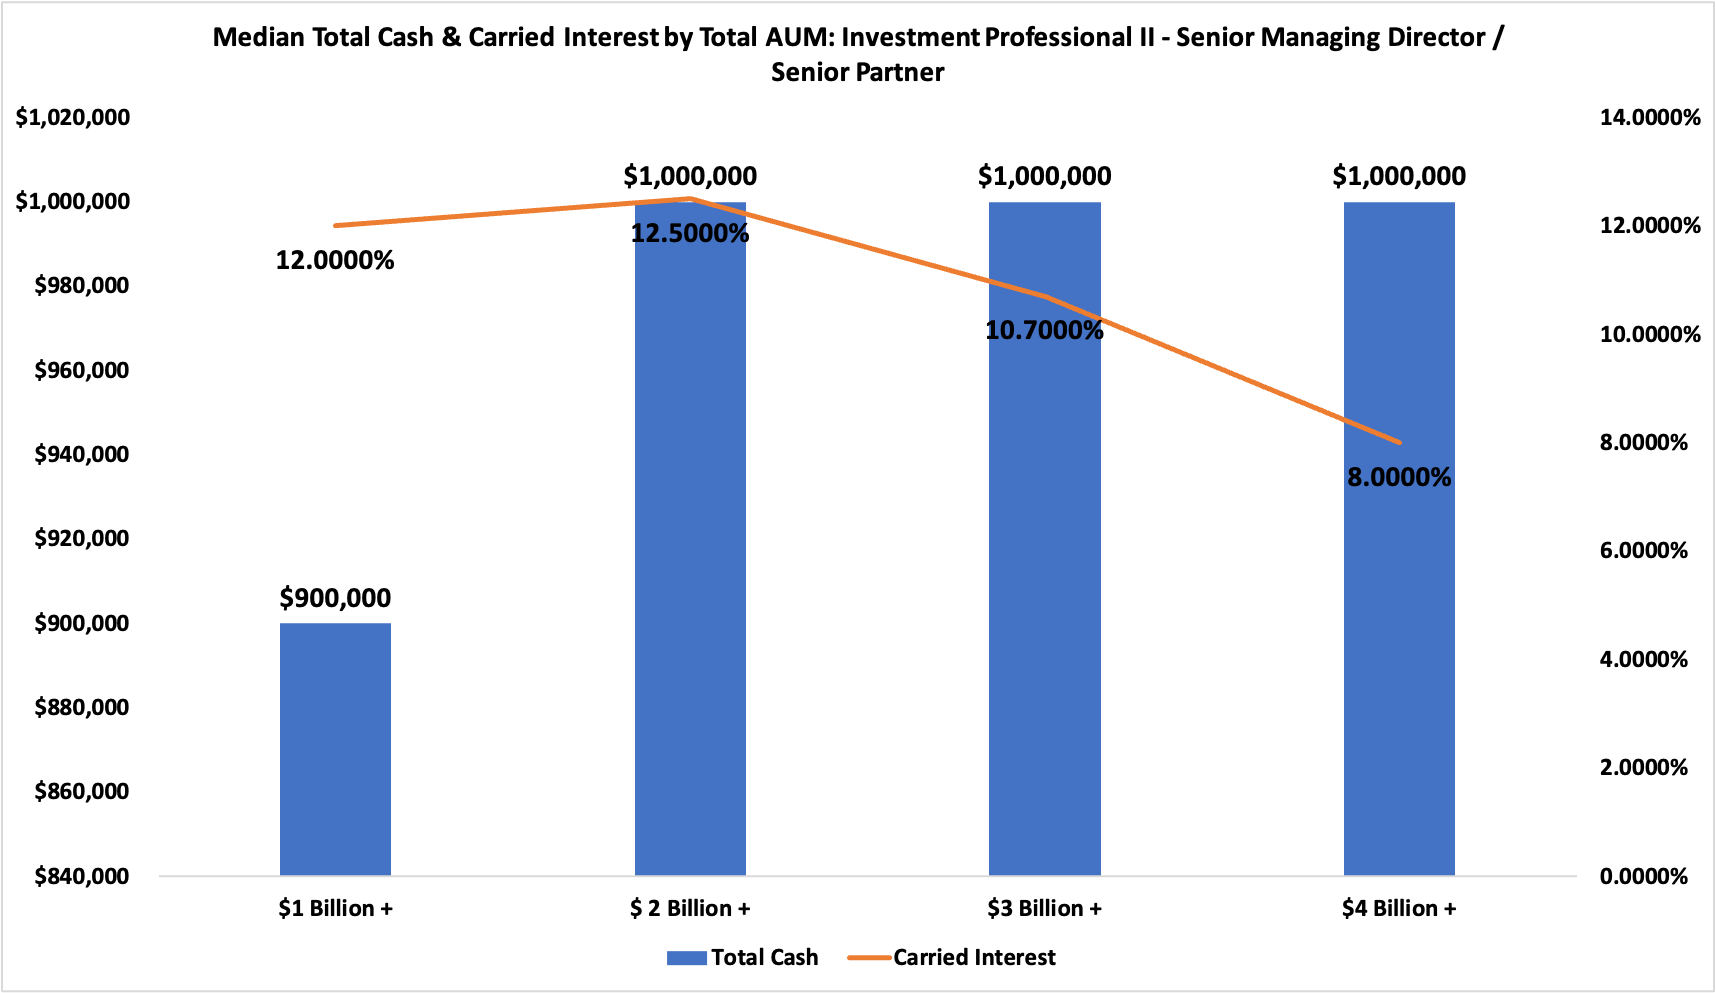
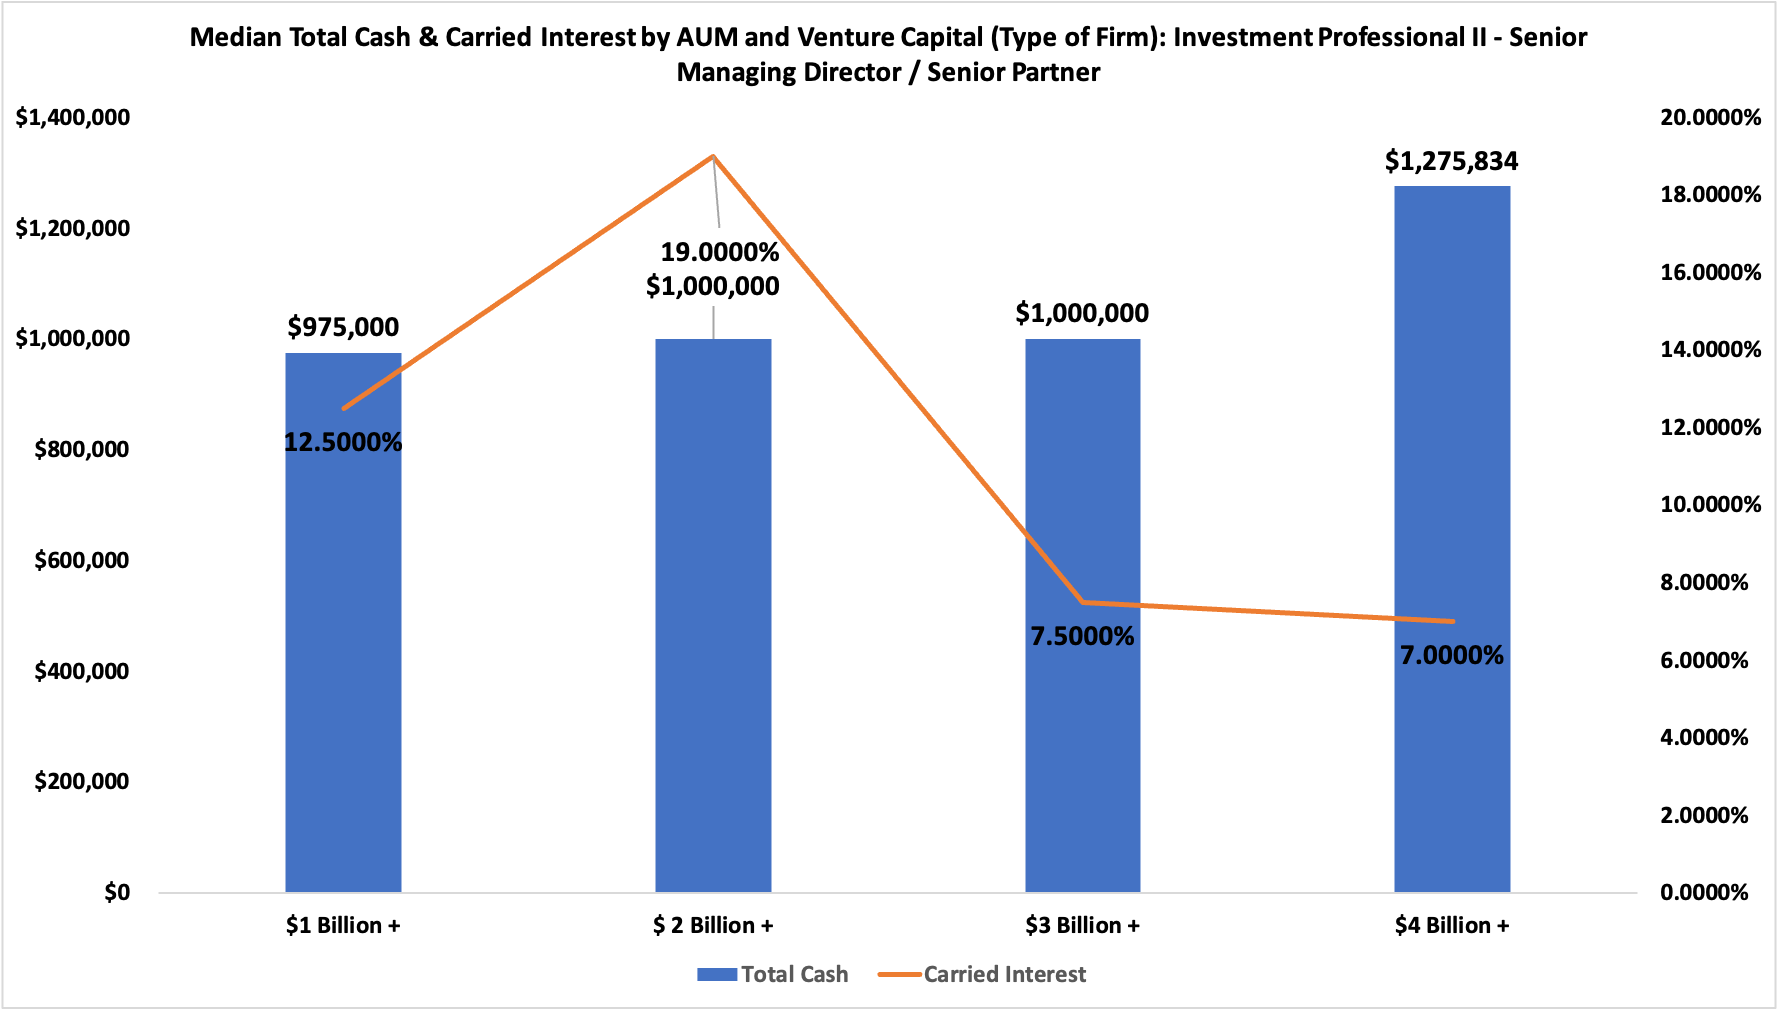
In order to explain which filters truly make a difference in compensation, we break it down by examining the median total cash and carried interest for investment professional II – senior managing director / senior partner. The two charts below customize the data by total assets under management (AUM) in addition to total AUM + Venture Capital (Type of Firm).
After examining the Thelander data above, here’s our takeaways:
Total Assets Under Management
AUM makes the biggest difference in the mix of cash and carried interest at investment firms. As the AUM increases, the median total cash steadily increases from $975,000 to $1,275,834.
Type of Firm
For this particular job, the type of firm filter didn’t dramatically change the total cash data. However, the carried interest percentage looked different with Venture Capital (Type of Firm) + Total AUM. The biggest difference can be seen at the $2 Billion + mark – where the median percentage of carried interest was 12.5000% without type of firm and 19.000% with venture capital.
Size of Most Recent Fund
This is helpful to use as a one-off to see the mix of cash and carry if you are investing out of multiple funds.
Region
You pay top dollar for top talent. Region is available as a filter on the platform – but the compensation is very competitive across the US especially in the more junior roles like senior associates, associate and analysts.
As you can see, there are many ways to look at data. Thus, you need a robust and comprehensive dataset that focuses on the private markets so you can make accurate comparisons. Thelander’s compensation data gives you the insights and analysis you need to make educated compensation related decisions from within your own firm to your portfolio companies.
| The Thelander Digest is powered by the Thelander Online Platform. Want to trial the platform? Participate in the Thelander-PitchBook Investment Firm Compensation Survey to secure your complimentary subscription. There is no cost to participate and all respondents will receive a complimentary silver subscription for the year. |
Participate In The Investment Firm Compensation Survey
Tags: Investment Firm, Newsletter