Thelander PC Digest: September 2025
Keep Your Finger On The Pulse of Compensation
In today’s fundraising environment, it is taking longer for companies to raise capital and when they do, the rounds are typically bigger, which helps secure a longer runway. According to the latest PitchBook Global Private Market Fundraising Report, “the tone has reverted to cautiously optimistic. The recent uptick in exit activity, coupled with announcements from large firms… is expected to improve fundraising sentiment.”
At the same time, hiring strategies have evolved. Companies have prioritized leaner teams and critical roles, so getting compensation right from the start is more important than ever because each role and individual is key. The sooner your portfolio companies put their compensation infrastructure in place, the stronger their foundation is for the long game, mitigating future problems.
This leads us to a frequently asked question: What’s the best way to look at private company compensation data? This month, we are going to dig into the answer by comparing compensation for two roles by:
A. Total amount of financing
B. Series
While the Thelander platform includes these filters (and eight more) and 2 million active data points, evaluating compensation based on A. the total amount of financing raised to date provides the most precise insights, which you’ll see below.
NEW: Access Customized Compensation Data With Your Free Silver Subscription
Before we dive into this month’s data, we want to share exciting news about the complimentary silver subscription your portfolio companies receive when they complete the Thelander Private Company Compensation Survey. Instead of having access to a predetermined list of job titles (the equivalent of a happy meal toy, you get what you get), we changed the model so that now, they get access to all the job titles they input data for. So, if they complete 100 job titles, they will get those exact 100 job titles back in return. This level of personalization means they can access the most relevant, real-time compensation data for their company, at no cost.
So invite them to participate! And now back to the data…
Participate in the Compensation Survey Today
Total Cash & Equity By Total Financing
One company’s Series A could be another company’s Series B, which is why the total amount of financing is important. Using the total amount of financing filter as a way to customize private company compensation data will allow you to drill down on the mix of cash and equity. Generally speaking, the earlier an individual gets into a private company, the more equity they will have – and the less cash. But, as we all know, the equity could amount to nothing – which is why it’s important to get the cash right as well.
Senior Scientists
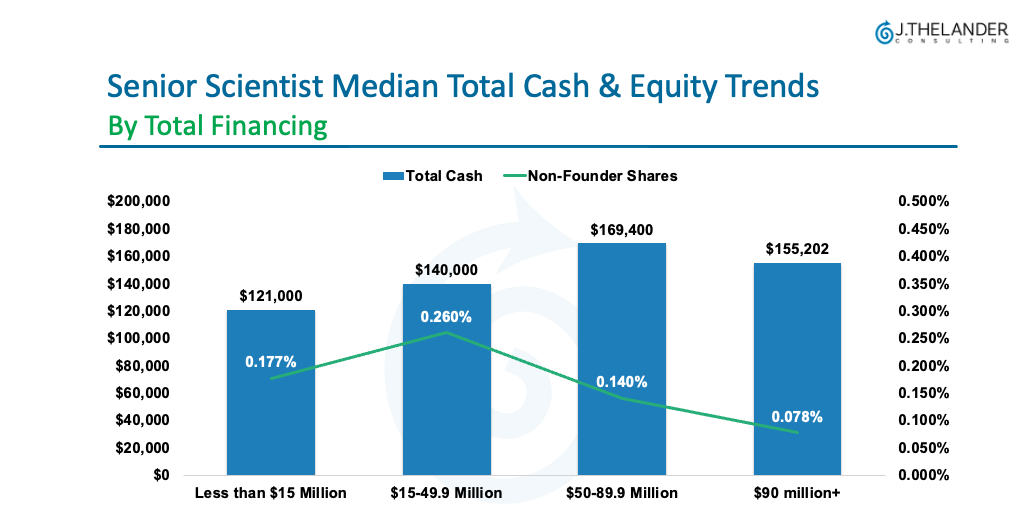
Key Takeaways:

The cash compensation rises from $121,000 (less than $15 Million) to $169,400, when a company reaches $90 million in financing, and then it levels off at $155,202 for $90 million+
The non-founder equity percentage increases from 0.177% (less than $15 Million) to its peak at 0.260% when the company has raised between $15 and $49.9 million in financing. The equity is diluted as the company raises more capital, which emphasizes why it’s so important to get the equity percentages right at the beginning.
As cash compensation rises, equity for non-founders get diluted.
How does the compensation compare when looking by series?
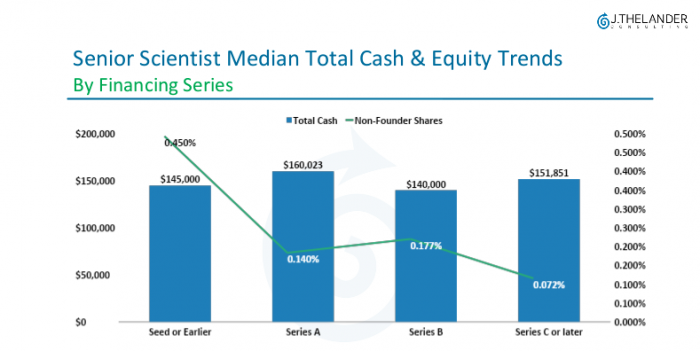
When looking by “Seed or Earlier” vs. less than $15 Million, the cash and equity are both higher – $145,000 vs. $121,000 and 0.450% vs. 0.177%
The median total cash peaks at Series A – $160,023. Whereas, the median total cash peaked at $169,400 in the $50 – $89.9 Million in financing chart.
Now let’s explore compensation for Senior Software Engineers, just one of the 315 job titles Thelander covers. If you’d like to see data for other titles or other industries, participate in our survey to unlock free access.
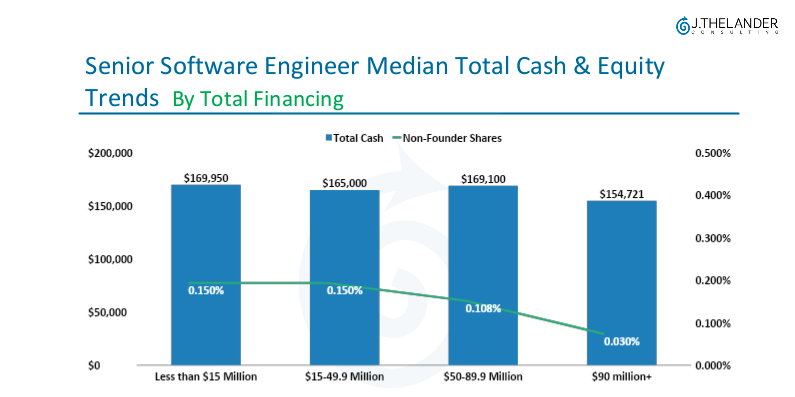
Cash compensation for senior software engineers remains consistent from $169,100 in companies with up to $90 million in total financing and then drops slightly to $154,721
Equity stays steady at 0.150% until a company raises between $50 and $89.9 million before dropping to 0.108% and 0.030%
What about by Series?
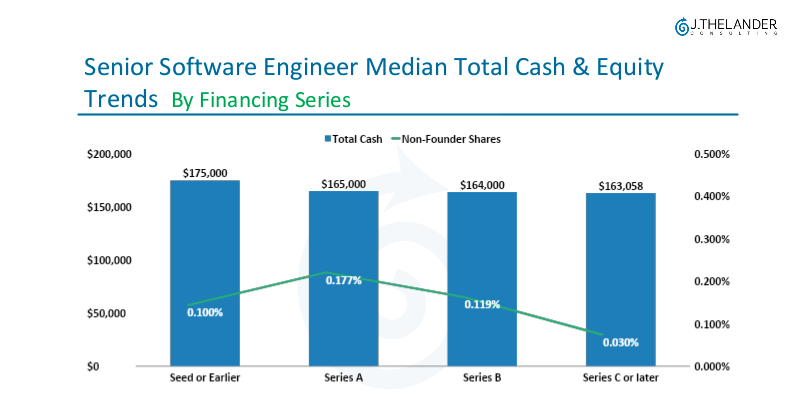
The median total cash is higher for Senior Software Engineers when looking at “Seed or Earlier” vs. the total amount of financing – $175,000 vs. $169,950. Otherwise, the cash is competitive – ranging from $165,000 to $163,058.
The equity peaks at Series A – at 0.1770%
What’s The Bottom Line?
Customizing compensation data is necessary – and some filters – like the total amount of financing are more precise than others. But, the most important takeaway is to have access to real-time, vetted compensation data so that your portfolio companies can put compensation infrastructure in place to ensure they get it right from the beginning.
Secure Real-Time Compensation Data by Participating Today
Access Free, Personalized Compensation Data Today
The Thelander Digest is powered by the no-cost Thelander Private Company Compensation Survey. By completing the survey, you will receive 12 months of complimentary access to real-time compensation data for all the jobs they submit data for. Invite your portfolio companies to join 3,000+ private companies who have already participated this year and rely on the results to make educated decisions on all aspects of compensation – and level up to compete for talent on a global level.
Tags: Newsletter, Private Company