Thelander PC Digest: November 2025
Gender Compensation Data
This month, we are digging into gender compensation data for executives and staff-level employees. According to the PitchBook – NVCA Q3 Venture Monitor Report, “80% of first-time financings go to all-male teams.” Thelander has been tracking gender compensation dat for the last 10 years.
So, how does this impact compensation?
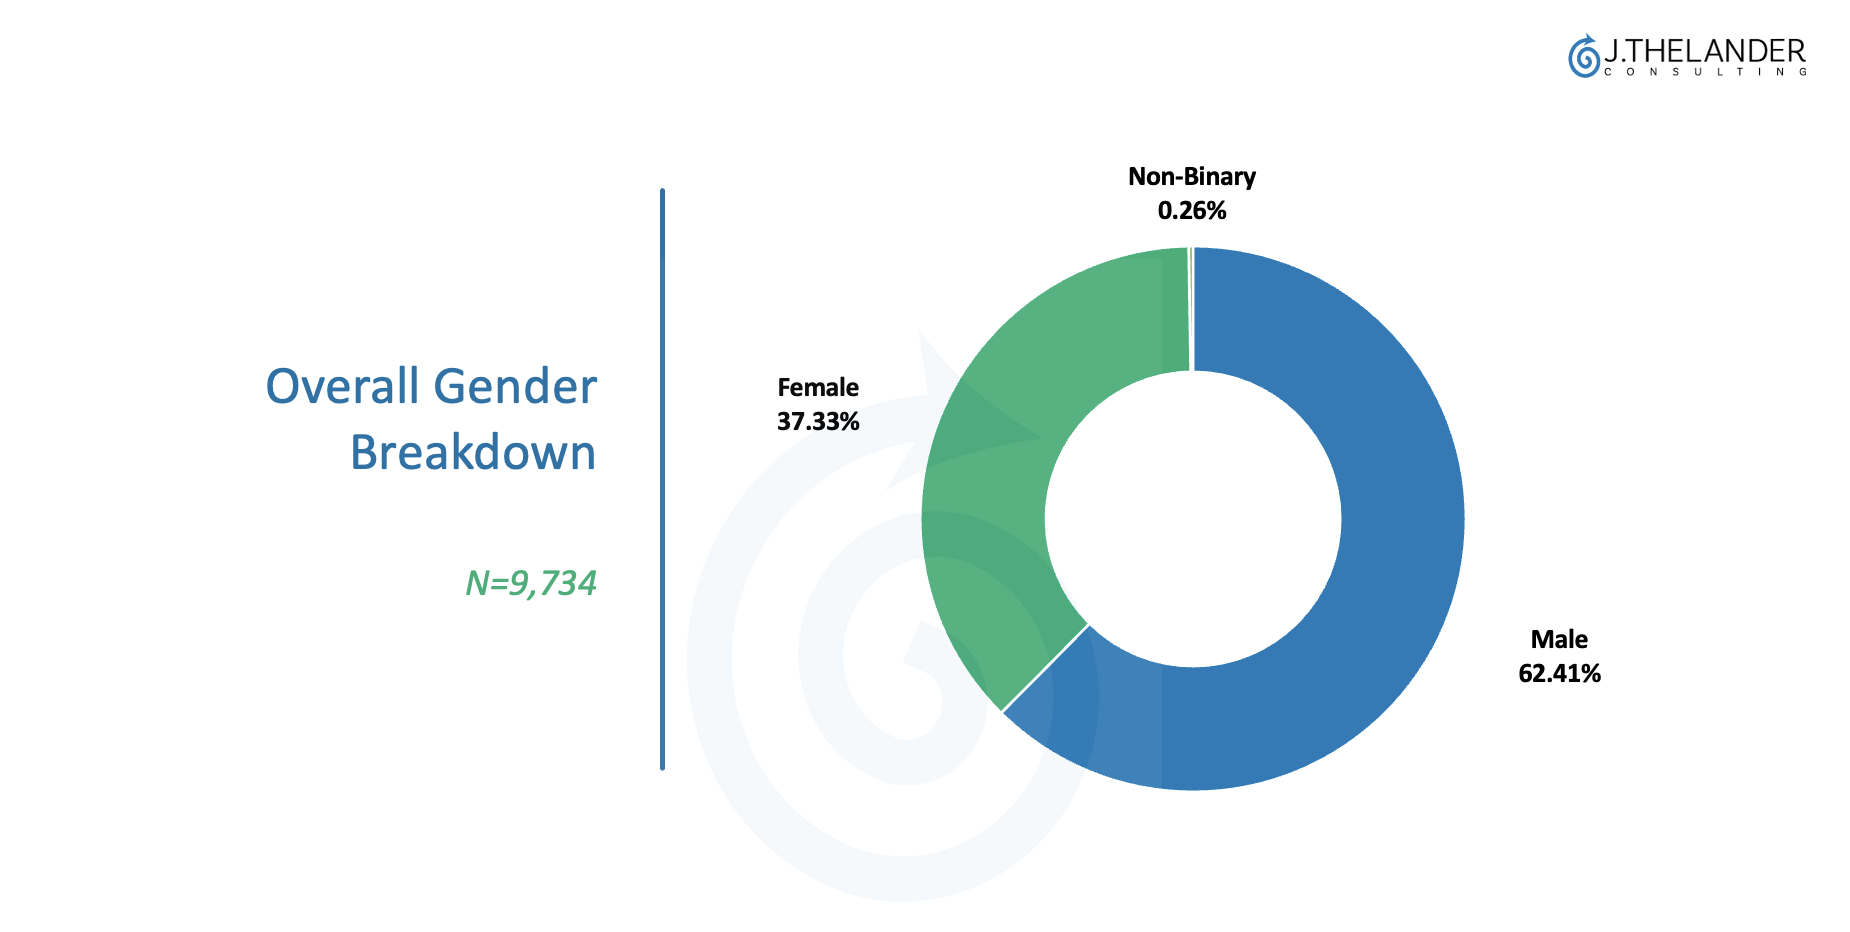
The composition of the 9,734 total employees whose gender was indicated in our 2025 Private Company Compensation Survey was:
- 62.41% Male
- 37.33% Female
- 0.26% Non-Binary
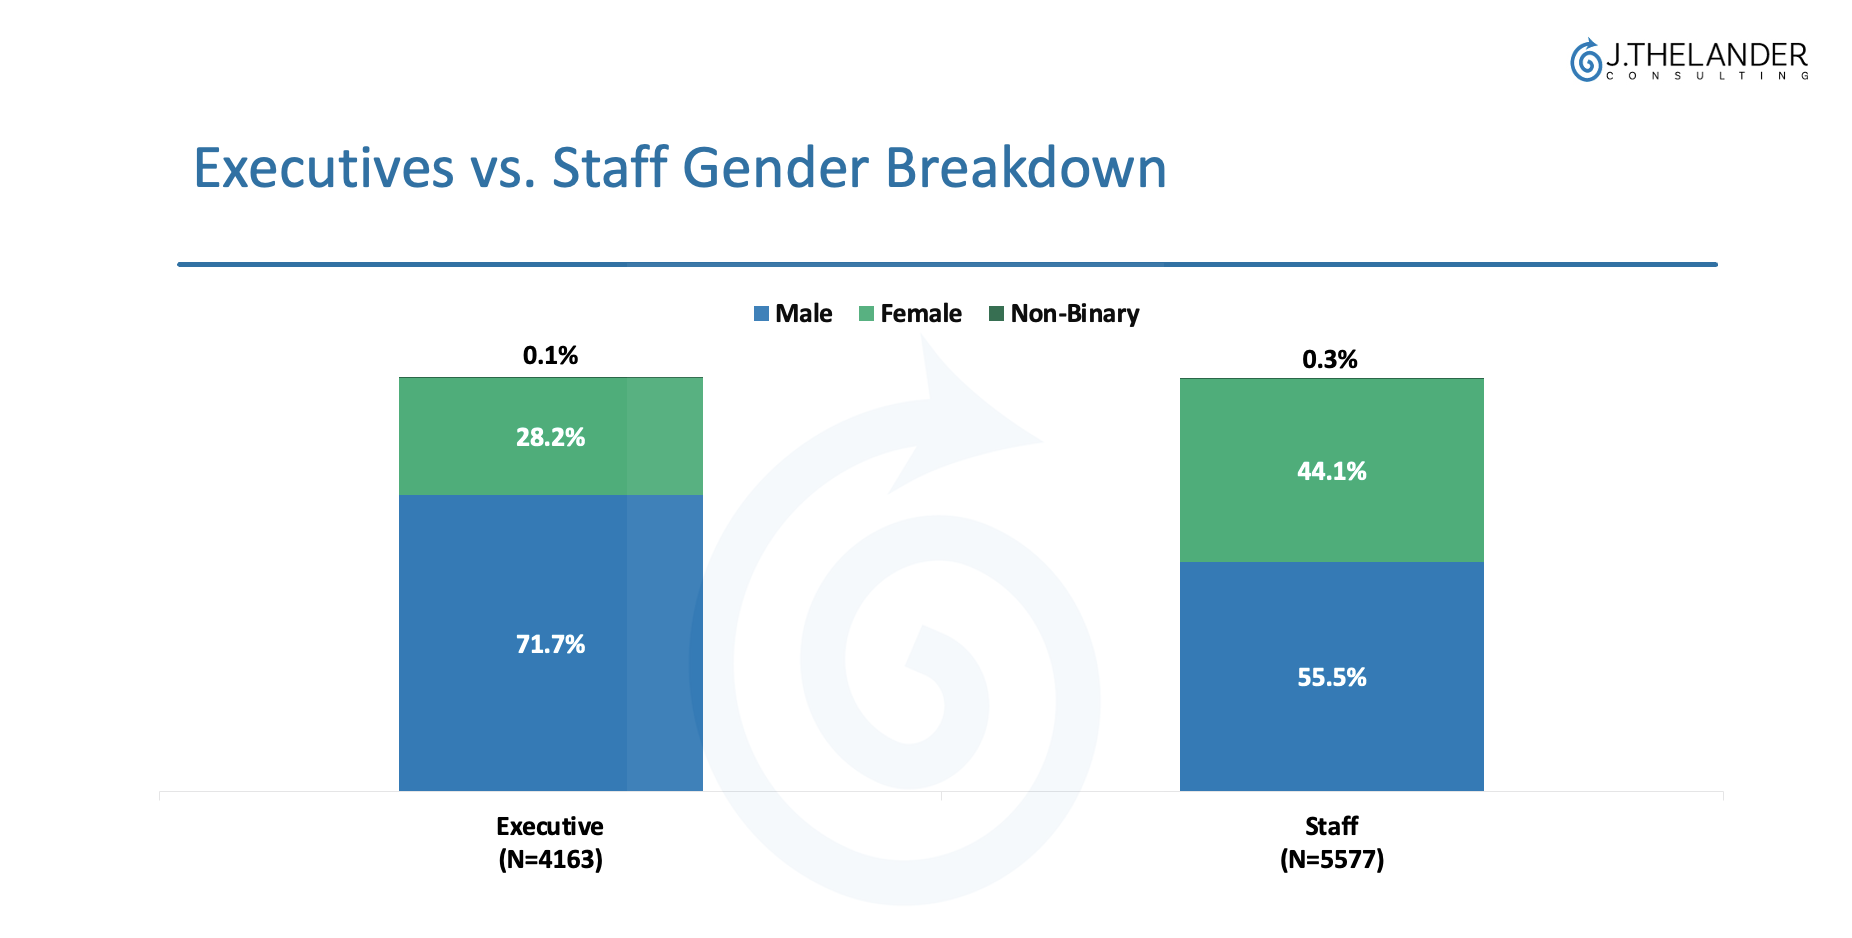
There is more to the narrative. How does the gender breakdown look by level of seniority – Executives (Chiefs and VPs) compared to Staff-Level Employees (below the VP level)?
Key Takeaways:

There is a large difference is gender composition between executives and staff, with executives roles tending to be much more male dominated than staff roles (71.7% vs. 55.5%).
Women in private companies have less representation among the high echelons of leadership, which means they have less access to the higher pay that goes with those senior roles.
How does this translate into real-time compensation data for CEOs?

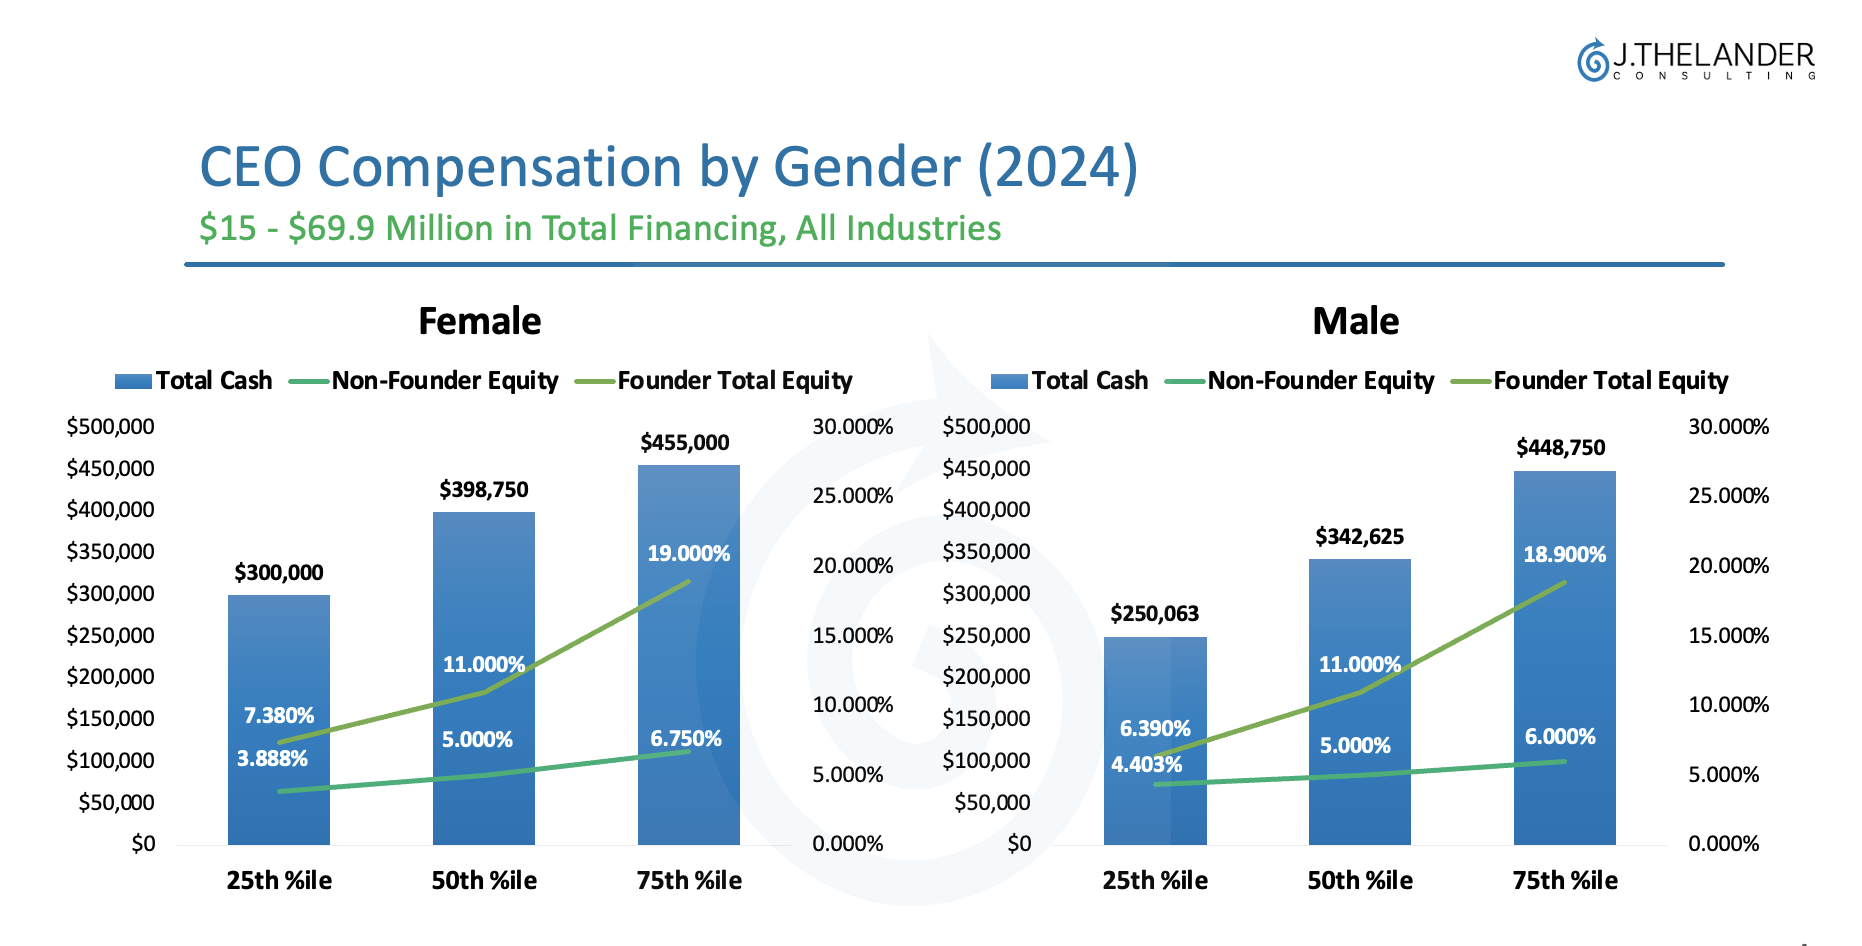
While there are fewer women, those who get to the CEO roles are doing well. When looking at the 25th, median and 75th percentiles for total cash, founder and non-founder equity for CEOs at companies that have raised between $15 and $69.9 Million:
Women are making slightly more than their male counterparts in total cash at every percentile except for the 75th percentile.
Female founders are taking home more in total founder equity for every percentile.
Non-founders CEOs are on par with their male counterparts in terms of equity percentages.
Where’s the catch? There are 216 data points for men compared to 56 for women. That means there is 1 female CEO to every 3.9 men.
How does this data compare to 2024?
![]() Similar to the real-time data, women CEOs are outperforming their male counterparts across all percentiles in total cash.
Similar to the real-time data, women CEOs are outperforming their male counterparts across all percentiles in total cash. ![]() The equity is competitive – regardless of gender.
The equity is competitive – regardless of gender.
As you move down the level of seniority and look at staff-level employees, Thelander data shows that:

Men make up the majority of engineers below the manager level (75% male).
Whereas women make up the slight majority of scientists (52% female).
How does this impact their compensation?
Key takeaways:
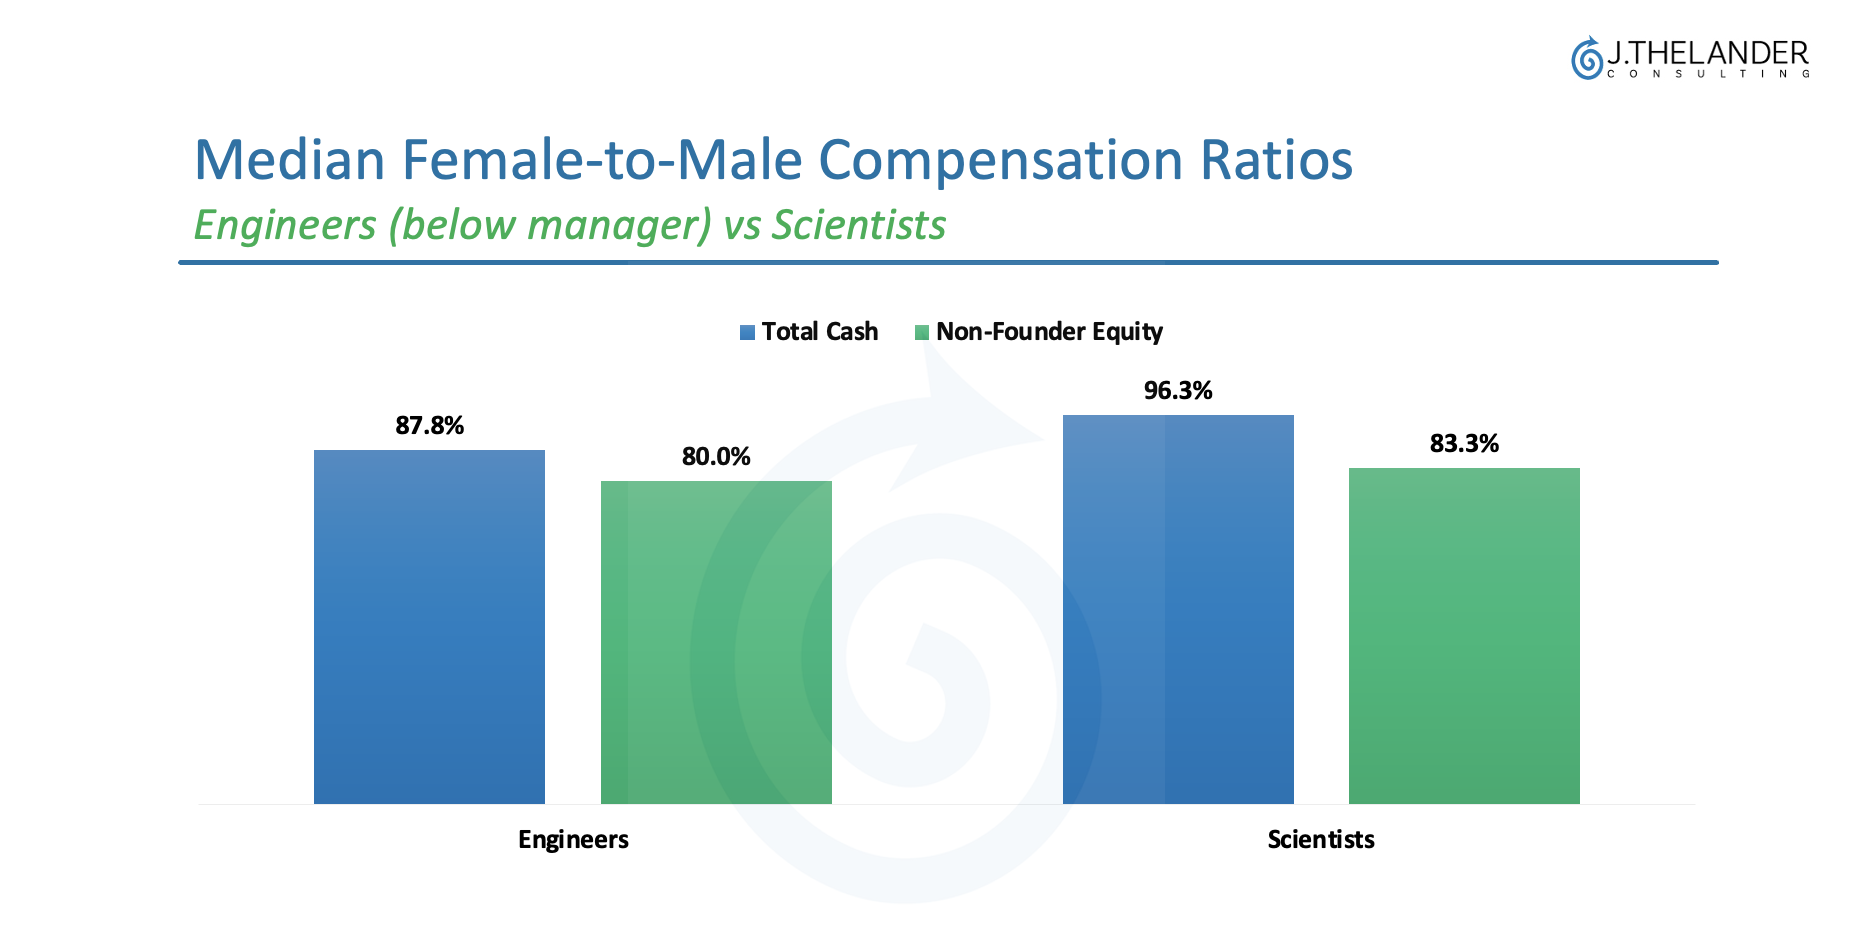
Engineers below the manager level are also more unequal in terms of compensation, with women making around 88% of what men do at the median in total cash and 80% in equity. The exact mix of cash and equity depends on the job title.
Male and female scientists are much closer to equality in terms of total cash, with women making around 96% of what men do. But, there is still a larger gap in terms of equity, with women only receiving around 83% of what men do.
What’s the bottom line? Having access to real-time, comprehensive and and trustworthy compensation data allows you to make educated decisions for your entire team – from C-Suite Executives to Staff-Level Employees. Trial the Thelander platform and access compensation data for every job title you complete in the Thelander Private Company Compensation Survey.
Complete The Thelander Private Company Compensation Survey Today
By completing the Thelander Private Company Compensation Survey, you will be able to access real-time compensation data for every job title you complete – including base salary, actual bonus amounts, bonus as a % of base salary, total cash, target bonus amounts, target bonus as a % of base salary and equity percentages for founder and non-founders. Complete your response today by clicking here.
Tags: Newsletter, Private Company