THELANDER RESEARCH · 2026
J. Thelander Consulting · Private Company Compensation
Get CEO pay right, and the rest of the organization follows. Explore how founder status, experience, industry, financing, and revenue shape the mix of cash and equity.
✓ Founder and non-founder cash & equity
✓ Benchmarks by experience, industry, and company profile
✓ Guidance for compensation planning and dilution

Thelander Research
Complimentary PDF · 20 pages
THIS REPORT IS SPONSORED BY
Interested in sponsoring a future edition? Contact Thelander.
A first look at the findings
A few findings from the guide show why the right comparison starts with your company’s profile.
FOUNDER EQUITY
At companies with under $50M in total financing, median founder CEO total equity is 20%, versus 5% for non-founder CEOs.
EXPERIENCE
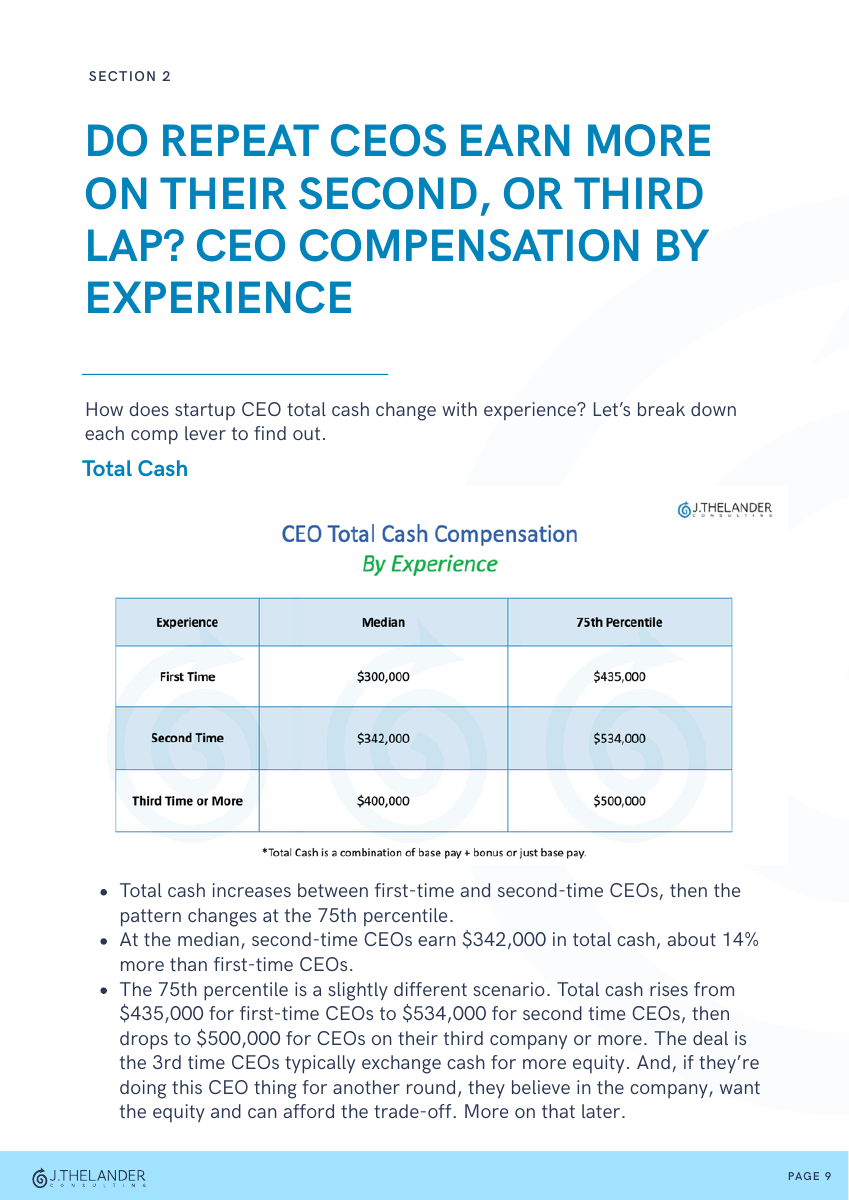
Second-time CEOs earn $342,000 in median total cash, compared with $300,000 for first-time CEOs.
TOTAL FINANCING
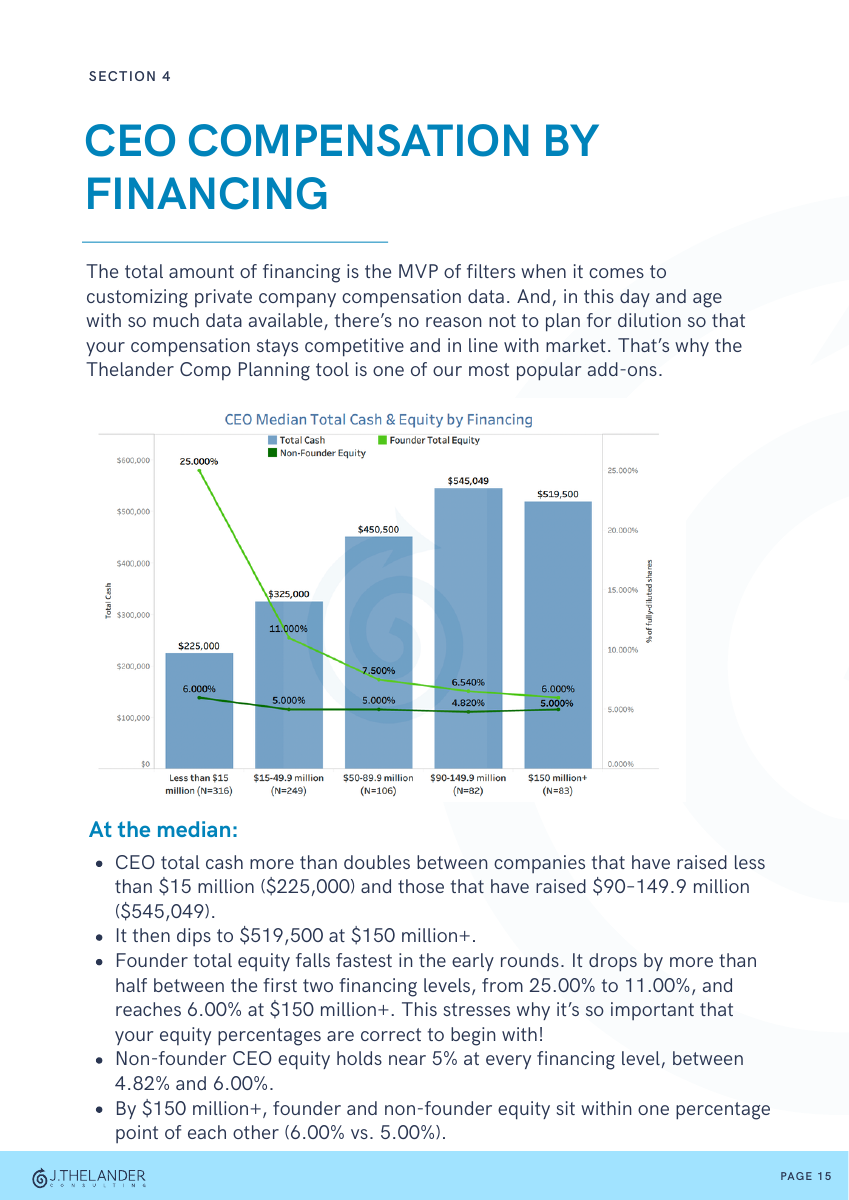
Median CEO total cash at companies with $90–149.9M in total financing, compared with $225,000 below $15M.
DILUTION
Median founder total equity falls from 25% below $15M in total financing to 6% at $150M+.
Introduction & benchmarking guide
pp. 2–4
Founder vs. non-founder CEOs
pp. 6–8
Repeat CEO compensation
pp. 9–11
CEO compensation by industry
pp. 12–14
CEO compensation by financing
pp. 15–16
CEO compensation by revenue
pp. 17–18
Next steps
p. 19
About Thelander
p. 20
A look inside
Use the report to understand market practice, choose relevant peers, and plan for your next stage of growth.
SECTION 1 · PAGES 6–8
Compare total cash and equity at companies with under $50M and $50–149.9M in total financing.
See how founder status changes the balance of cash and equity.
Get the full report →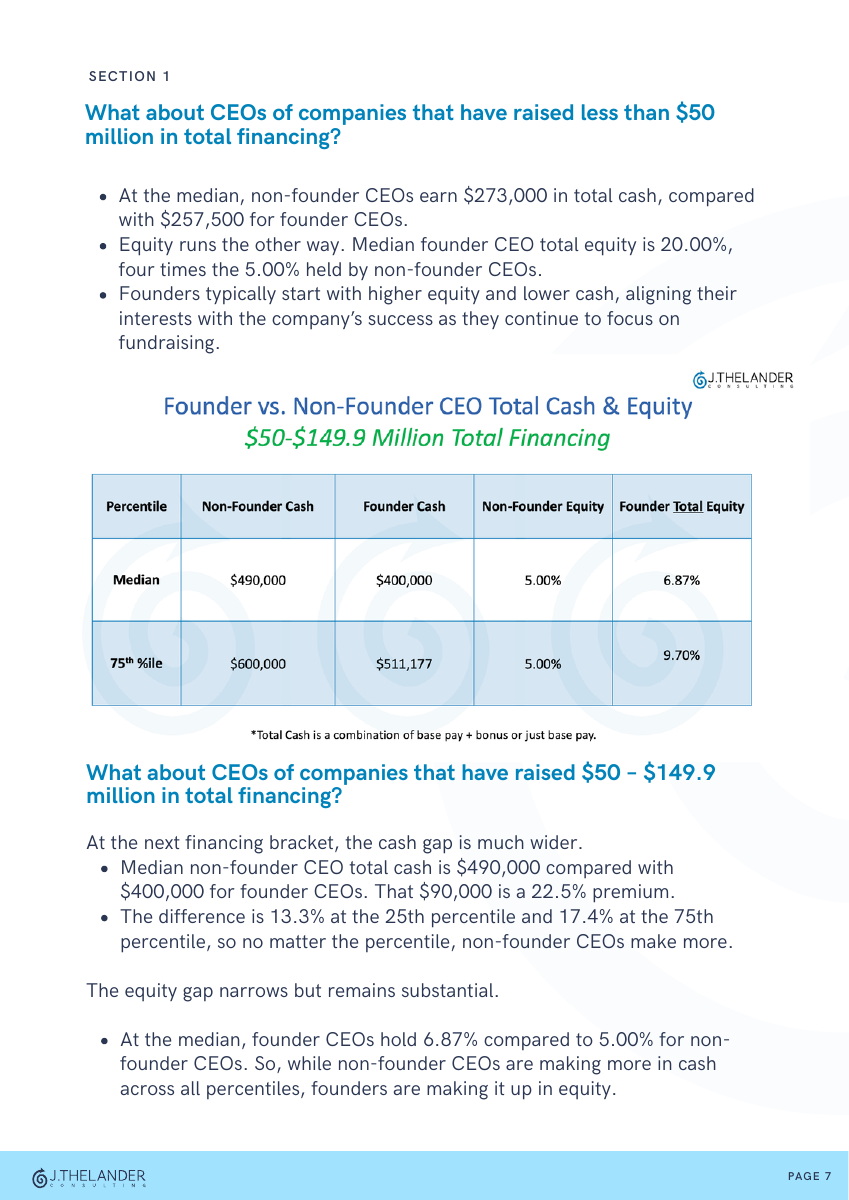
KEY FINDINGS
At companies with under $50M in total financing, median founder CEO total equity is 20%, compared with 5% for non-founder CEOs. Non-founder CEOs receive more total cash at both financing levels covered in the report.
Second-time CEOs earn $342,000 in median total cash, about 14% more than first-time CEOs. CEOs on their third company or more hold the most founder total equity at the median.
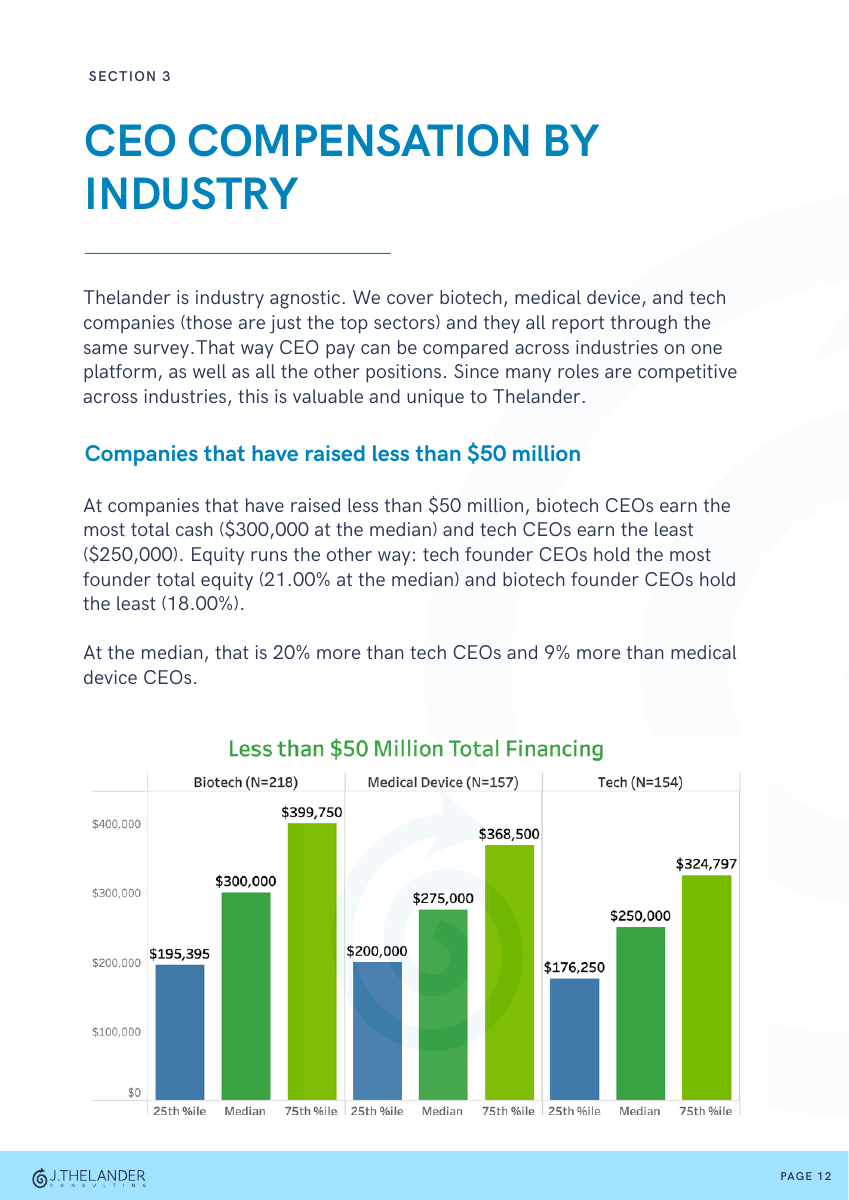
The report compares biotech, medical device, and tech companies. Biotech CEOs earn the most median total cash at both financing levels covered, while tech founder CEOs hold the most founder equity below $50M in financing.
Median CEO total cash rises from $225,000 below $15M in total financing to $545,049 at $90–149.9M. Median founder total equity falls from 25% below $15M to 6% at $150M+, underscoring the importance of dilution planning.
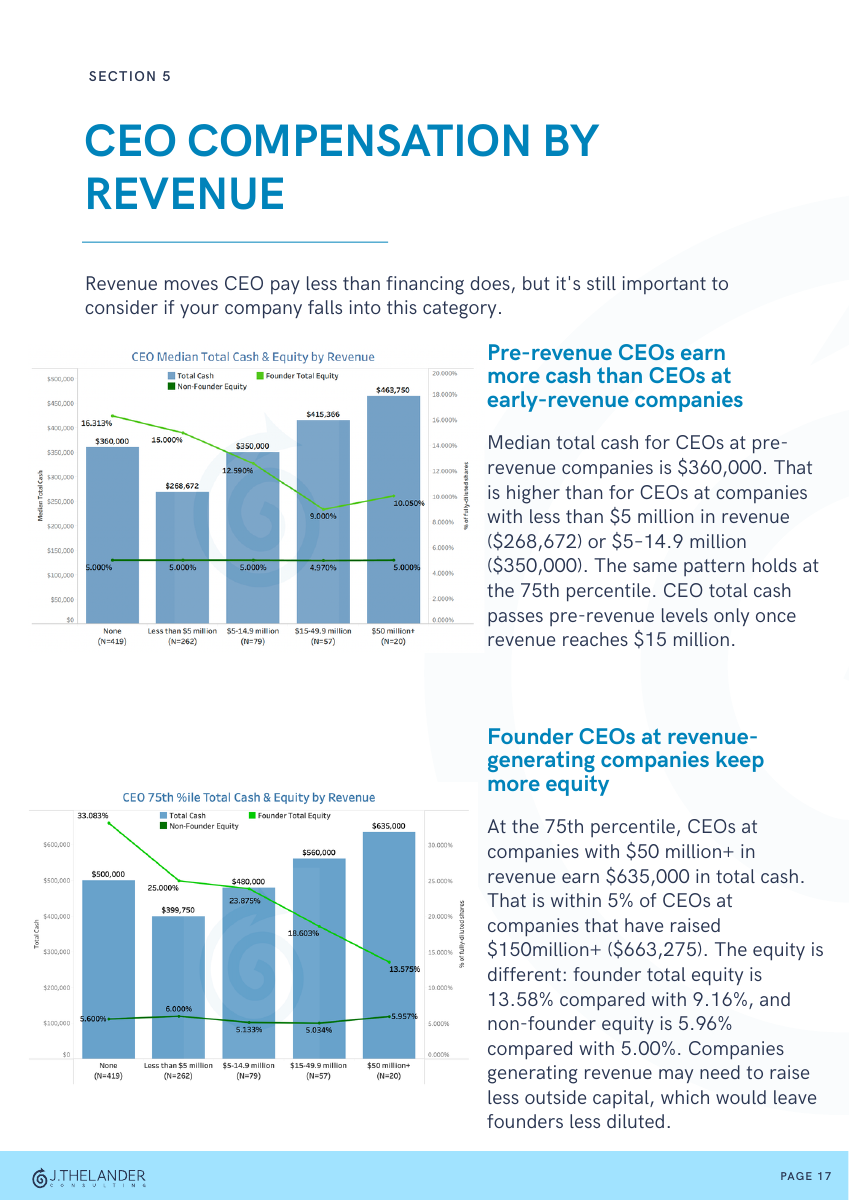
For revenue-generating companies, the guide recommends considering financing and revenue together. For companies without revenue, total financing remains the primary filter. Total cash is base pay plus bonus, or base pay alone if no bonus was awarded; equity is a percentage of fully diluted shares.
Before you download
Startup and private-company CEOs, founders, boards, and executives making compensation decisions. The guide covers both founder and non-founder CEOs.
The guide uses the Thelander Private Company Compensation dataset. The survey collects information directly from privately held companies, stays open year-round, and updates daily on the platform. All data is published in aggregate, without individual or company names.
Complete the no-cost Thelander Private Company Compensation Survey to unlock real-time cash and equity data for each title you submit, free for 12 months. The survey takes under 20 minutes on average, depending on the number of titles submitted, and white-glove support is available.
Founder total equity combines shares awarded for being a founder and any additional shares awarded for the founder’s current job. Non-founder equity is reported separately. Total cash means base pay plus bonus, or base pay alone if no bonus was awarded.
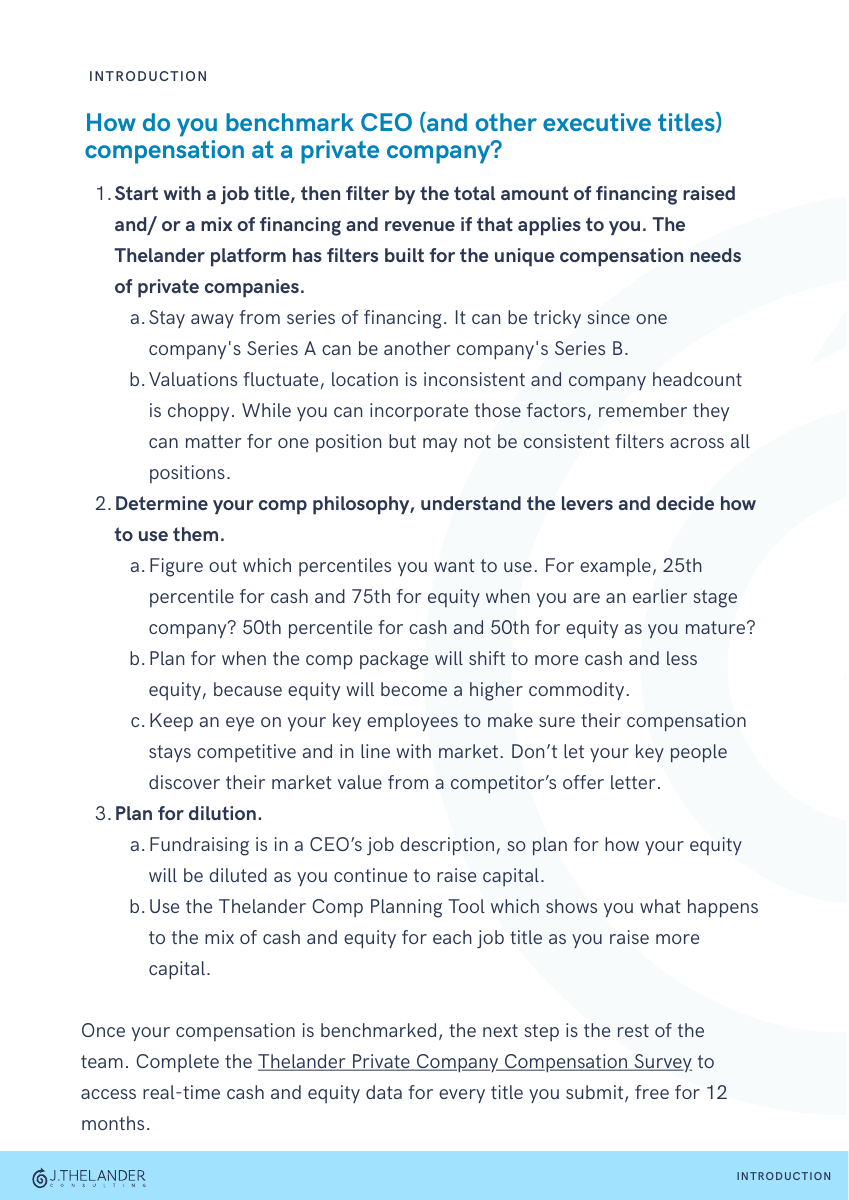
The guide recommends starting with the job title and total financing raised, adding revenue where applicable. It also explains how to set a compensation philosophy and plan for dilution as the company raises more capital.
Yes. Download the complimentary 20-page PDF using the form above. The report offers a starting point; the Thelander Platform provides more detailed cash and equity benchmarks.
Your next compensation decision starts here
Download the Startup CEO Compensation Report, then explore deeper role-level benchmarks with Thelander.