Weekly Compensation Blog

How does compensation change with fund size?

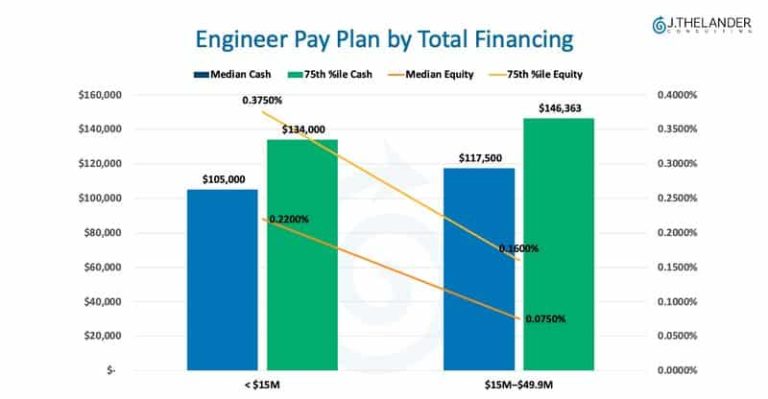
For privately held companies, we know how it (generally) goes – as a company raises more capital, the total cash increases as the equity decreases on the compensation front. While the exact mix of cash and equity depends on the role and company specifics, the same pattern generally holds true for investors at venture capital firms except instead of cash and equity, it’s cash and carry.  The exact compensation mix depends on a number of factors like the total AUM, size of most recent fund and type of firm… and using the comp planning tool from the Thelander platform, we
Read More »

Private Company 2027 Salary Increases 2027: How to Plan

Whether you’re a founder or CEO thinking on behalf of the company or an individual wondering about your own compensation, by this time of the year, salary increases have probably crossed your mind. And for good reason. There’s a lot of movement in the private capital market. The way companies are hiring is very different from what it was in 2021 and 2022 (the lemon years) and executives are thinking about who is essential to the business and how to incentivize them to stay. And, let’s be honest, when someone is paid competitively and happy with their comp, they stop thinking

Read More »

How does executive equity change from Seed → Series A → Series B?

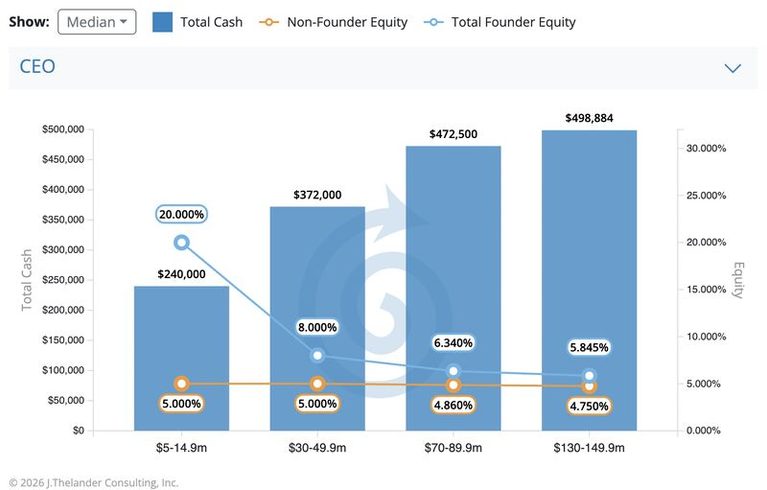
While we like to stay away from the word *should*, the real question is – how does executive equity change as a company raises capital? This week, we’re continuing our deep dive to answer your frequently asked compensation questions. Using the comp planning tool from the Thelander Platform, (a hybrid of our dataset and consulting resources, now off the shelf), we’re looking at how equity changes for a CEO as they raise capital. So, how does it change? What does this mean for you and your team? How do you plan ahead? If you’re a CEO raising capital here are

Read More »

Startup Compensation Benchmarks: The 7 Hires You Need to Get Right

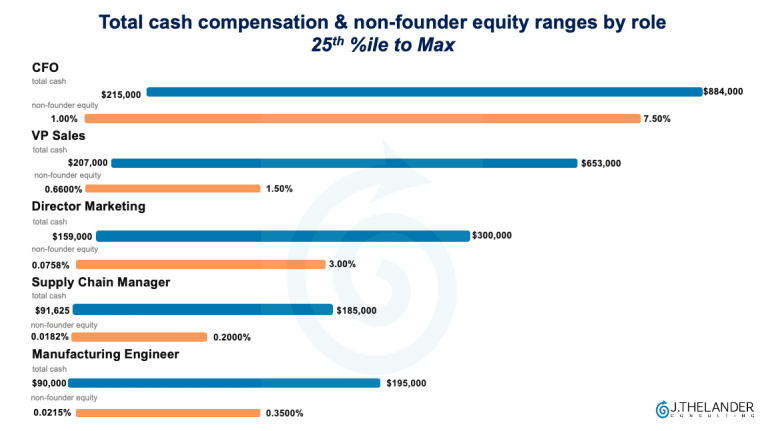
A few weeks ago, we read an a16z newsletter on the “7 hires a hardware startup needs to get right” that outlined the seven functions (besides engineering) that determines whether a “great product ever becomes a great business.” Which include: Manufacturing, Deployments, Supply Chain, Finance, Sales, Policy and Marketing. And while the piece described how to find the right person, and how to know when you’ve found the right person, they didn’t touch on what it takes to compensate those roles. That’s where we come in. While we’re looking at data for all types of private companies – including hardware and tech

Read More »

What does a Chief of Staff make at Venture Capital firms?

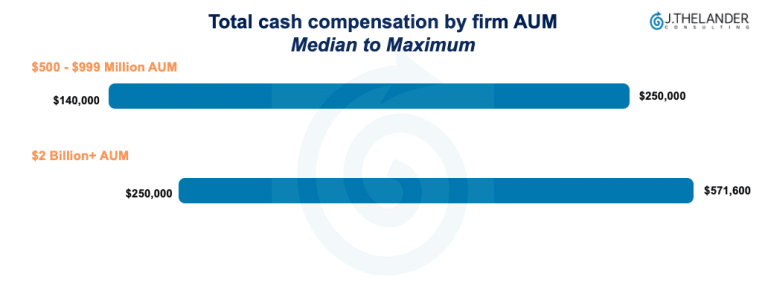
 If you’ve been scrolling LinkedIn and you’re in the private capital market, chances are you’ve seen firms hiring for a Chief of Staff (CoS). Since we added the title into the Thelander-PitchBook Investment Firm Compensation Survey in 2023, not only have we seen the number of respondents surge, but the compensation too. At what point do venture capital firms hire a CoS? Thelander data shows that these roles become prevalent after the $500 million AUM mark is passed. Firms with $500 – $999M in AUM are paying $140,000 (median) to $250,000 (maximum) in total cash with no carry included in

Read More »

QSBS Eligibility: How Investment Firms Track It

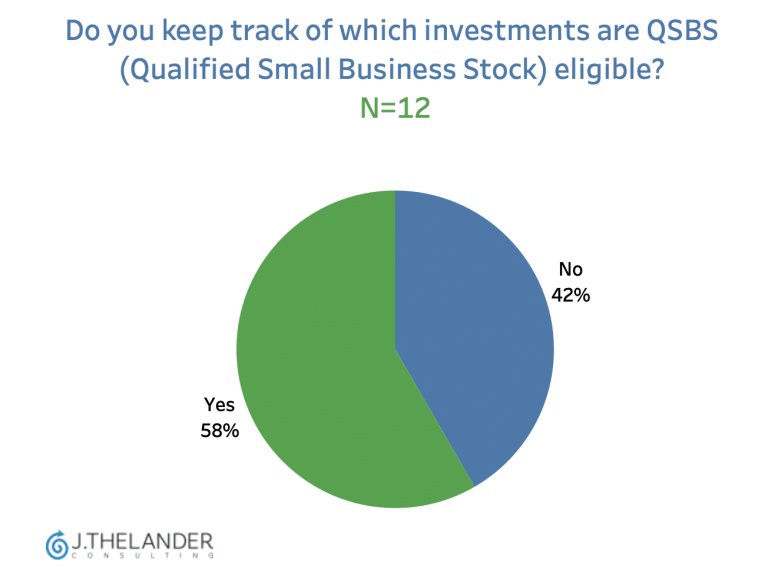
Carried Interest & Management Fees Report Have you participated in the Thelander-PitchBook Investment Firm Compensation Survey yet? Secure your complimentary Carried Interest & Management Fees Report when you complete your response by August 17th. Click here to participate. Exclusive Preview From the 2026 Report So far, more than half of respondents keep track of which investments are QSBS (Qualified Small Business Stock) eligible. But only 17% have a strategy for structuring investments to improve or preserve that eligibility. Among those who track it, eligibility varies — equal shares report that less than 50% or 50–80% of their investments qualify, with a

Read More »

Biotech CEO Compensation: The Real Inflection Point

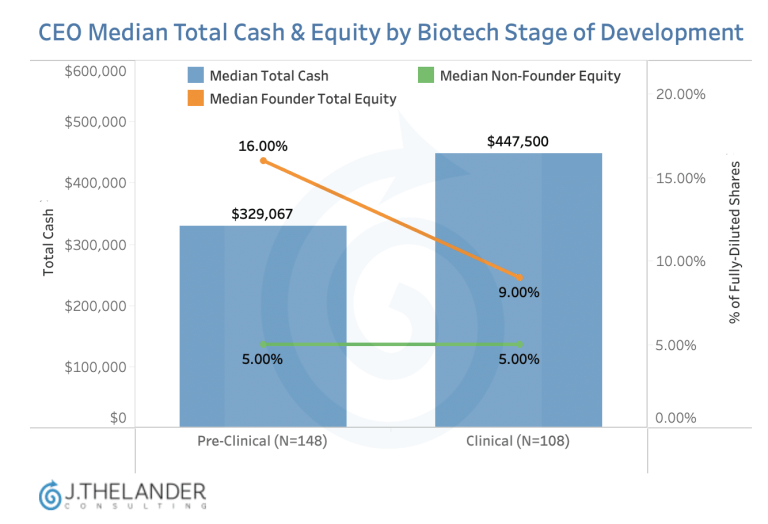
The real inflection point in biotech CEO compensation isn’t between early and late clinical trials. It’s the leap from pre-clinical to clinical. In this data drop, pulled directly from the Thelander Platform, we looked at how median total cash, founder and non-founder equity changes across biotech stages of development. Pre-Clinical → ClinicalMedian total cash: $329,067 → $447,500Median total founder equity: 16.00% → 9.00%Median non-founder equity: Steady at 5.00% Clinical Phase I → Phase II/IIIMedian total cash: $452,500 → $445,720Median total founder equity: 7.99% → 9.90%Median non-founder equity: 5.00% → 4.74% The takeaway? CEO total cash jumps significantly between the pre-clinical

Read More »

AI in Venture Capital and Private Equity: How Firms Differ

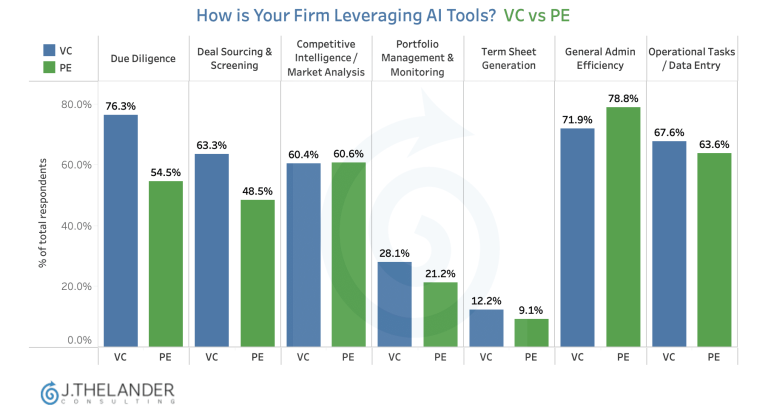
Using data from the Thelander AI in VC report (available on the Thelander Platform for no charge), we looked at how AI in venture capital and private equity is being used in very different ways — and the data shows a clean split by firm type. VC firms are more likely to use AI for investment and management tasks, especially due diligence and deal sourcing and screening.  Whereas PE firms are more likely to use AI for admin efficiency purposes. More than 50% of PE firms that use AI also use it for: – Due Diligence– Competitive intelligence / market analysis– Operational

Read More »

Venture Capital Compensation by Role: What the Data Actually Shows

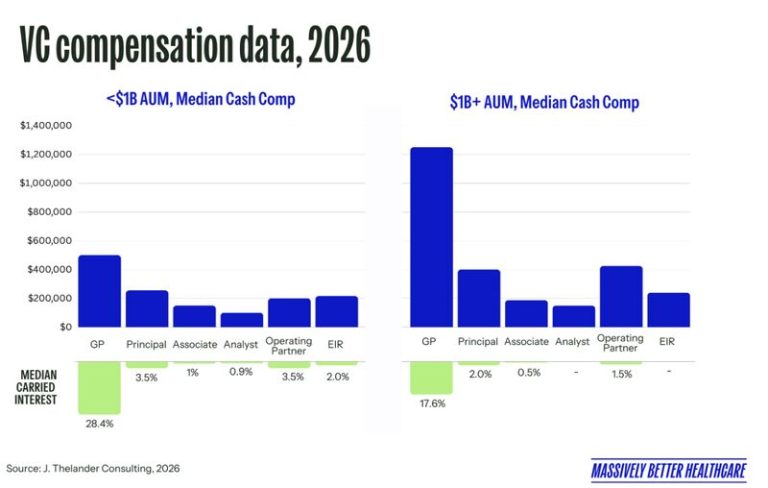
Any day Thelander data is used in a Halle Tecco, MPH, MBA blog post is a good day. Halle updated her post on “The Many Roles at a Venture Fund — And How to Land Them” with real-time (& exclusive) compensation data from the Thelander platform for six job titles. We customized the data by under $1 Billion and $1 Billion+, Venture Capital only — but subscribers can get even more granular than that. A few highlights: Participate in the Thelander-PitchBook Investment Firm Compensation Survey to see how your cash and carry compare to market benchmark today. There is no

Read More »

Investment Firm Compensation: What Associates and Managing Directors Are Making

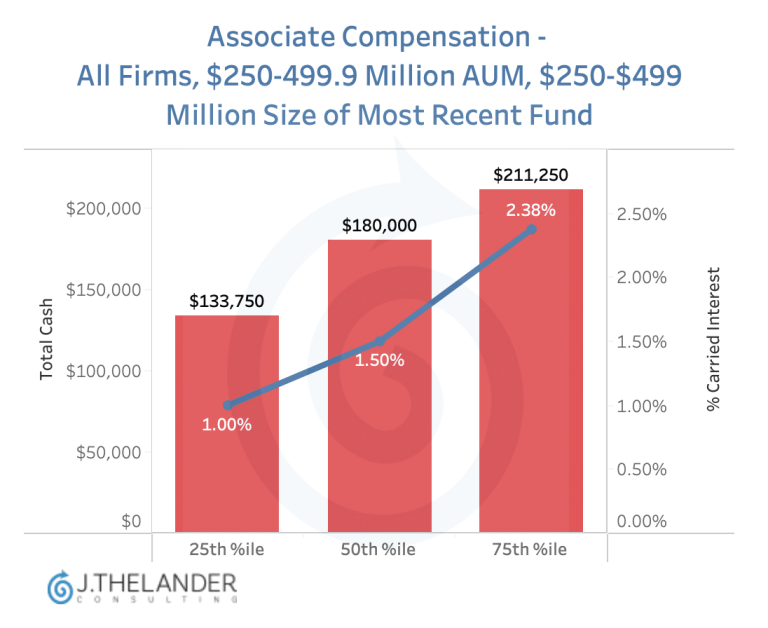
In honor of America’s 250th birthday, we’re sharing real-time comp data (straight from the Thelander platform) for all investment firms with $250 – $499M AUM and a most recent fund of $250 – $499M. Here’s what Associates & Managing Directors / Partners are making: Chart #1: AssociatesTotal cash ranges from $133,750 at the 25th percentile to $211,250 at the 75th percentile, with carried interest ranging from 1.00% to 2.38%. Chart 2: Managing Directors/Partners Total cash ranges from $386,500 at the 25th percentile to $487,500 at the 75th percentile, with carried interest ranging from 8.75% to 18.00%. Before signing off for

Read More »

Operations Managers Pay is Up 31% – Here’s Why

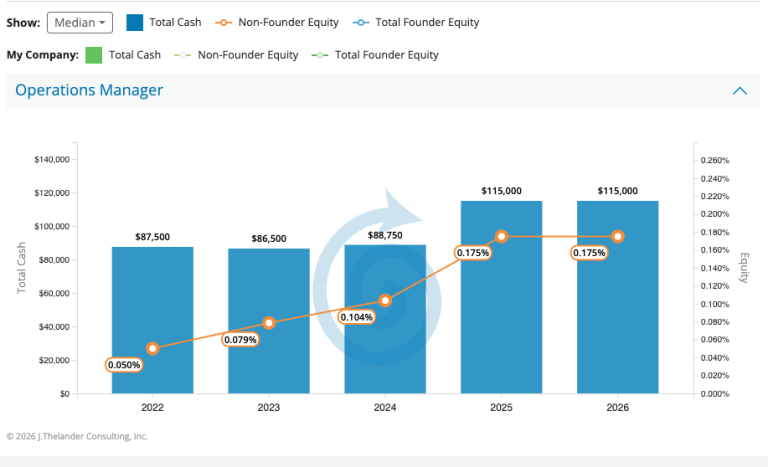
As venture rounds get bigger and the sub-$5M round disappears (PitchBook), it’s changed the way that companies recruit and retain talent – and the YoY compensation data is changing as a result. Take Operations Managers at companies that have raised less than $15 Million. Median total cash compensation has increased from $87,500 in 2022 to $115,000 in 2026 – a 31% increase. At the 75th percentile, total cash has grown from $120,000 to $140,554 over the same period. Non-founder equity has steadily trended up from 0.050% in 2022 to a peak of 0.175% in 2025 and holding there into 2026.

Read More »

What Talent Partners at Venture Capital Firms Are Making

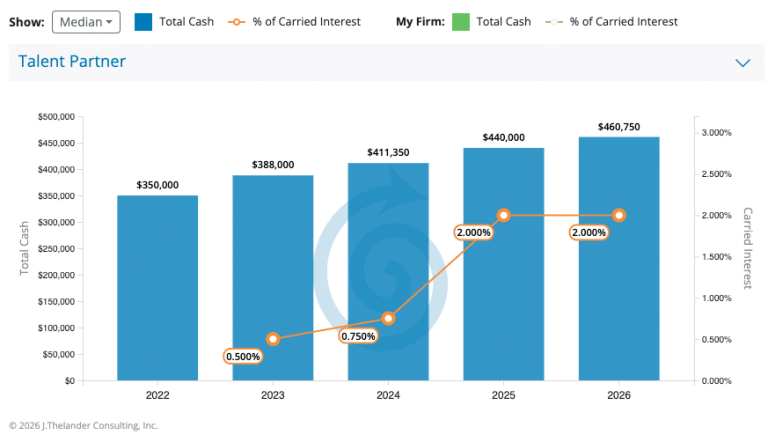
Venture capital firms are increasingly building out dedicated talent teams to help portfolio companies hire executives and scale their teams, a model long used by CVC Units. As these roles have become more strategic, compensation has followed. We dug into the Thelander YoY dataset (available through an investment firm subscription) to see what Talent Partners at VC firms with more than $1 Billion in total AUM are actually making. Chart 1: Median Talent Partner YoY Compensation Chart 2: 75th Percentile Talent Partner YoY Compensation The Bottom Line: Compensation for talent teams is moving in one direction — up. Talent Partner

Read More »

Private company M&A activity is up. Is your company prepared? Find out in 2 charts.

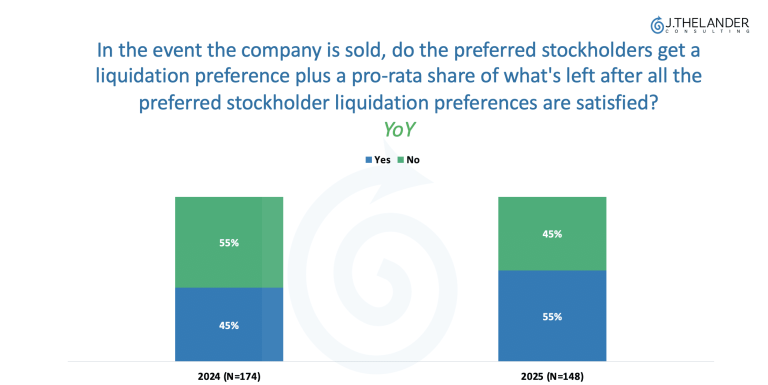
Global M&A hit a historic milestone in Q1 2026. According to PitchBook, “total deal value reaching an estimated $1.6 trillion—a new quarterly record—up 50.6% YoY despite a backdrop of trade policy uncertainty, geopolitical tension, and AI-driven disruption risk.” North America led the way, and “liquidity remains abundant with buyers and sellers finding terms.” With M&A activity at record levels, one of the most important things to have in place before a transaction are your liquidation preferences. Liquidation Preferences Whether preferred stockholders receive a liquidation preference plus a pro-rata share determines the portion of the proceeds remaining for founders and employees,

Read More »

Startup Tech Compensation Trends: IT Manager Pay Has Nearly Doubled. Software Engineer Pay Hasn’t.

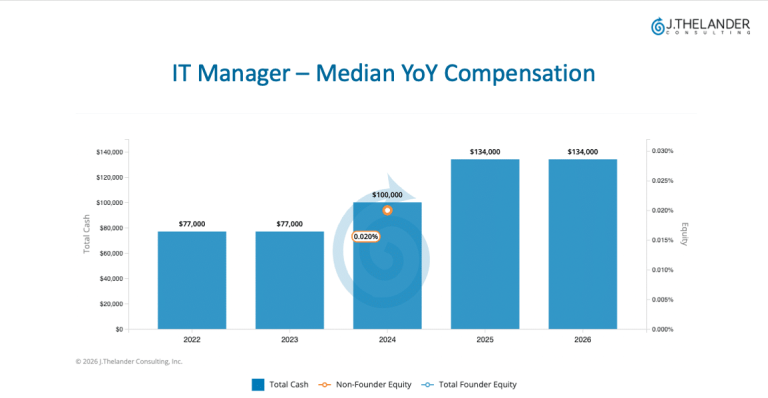
Last week, Katherine Bindley from The Wall Street Journal published an article on “The Tech Jobs That Are Safe From AI.” She reported that senior IT and computer science job postings are up YoY – while entry level postings are down – which motivated us to look whether the same was true for compensation at tech startups. Using the year-over-year compensation trend dataset on the Thelander Platform, we looked at tech startups who have raised less than $50 million. Here’s what the data told us: Median total cash for entry-level (associate) software engineers has stayed steady since 2022 – hovering

Read More »

Pay Transparency Is Exposing a Bigger Problem: Private Companies Can’t Explain Why They Pay What They Pay

In a Fortune article published this week on the pay gap and pay transparency, the takeaway wasn’t that companies aren’t sharing pay — it’s that they can’t explain it. Private companies with fewer than 200 employees need a salary structure with total cash and equity ranges. And sure, having a job architecture and salary structure makes you compliant with pay transparency laws — but more importantly, it gives you the reason why you’re paying Jane, a Level II Software Engineer, X dollars in total cash and Y percentage in fully diluted shares. The companies that can explain why they pay

Read More »

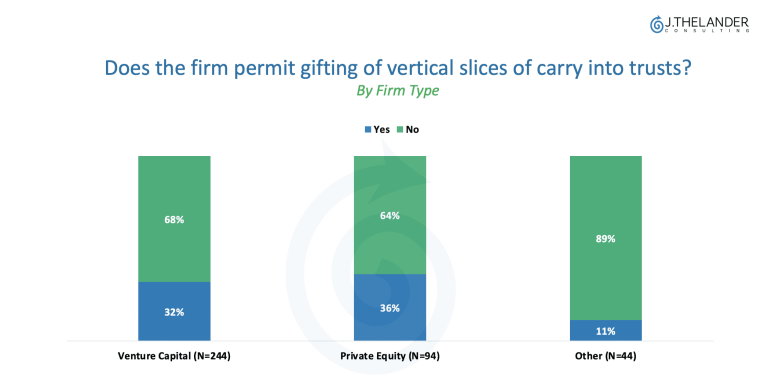
One in three investment firms gift vertical slices of carry into trusts. Is yours one of them?

Carried interest is one of the most powerful levers in venture capital and private equity compensation. In our recent webinar with GetDynasty.com, we discussed putting part of your carried interest (and committed capital) into vertical trusts. Here’s what the data says, and what you need to know before you act. When it comes to gifting vertical slices of carry into trusts, roughly one in three firms — both VC and PE — currently permit it. But the patterns shift meaningfully by firm type and AUM. PE firms with less than $500 million in AUM are more likely to allow it

Read More »

The AI Equity Premium: What the Data Shows Across Private Tech and Life Science Companies

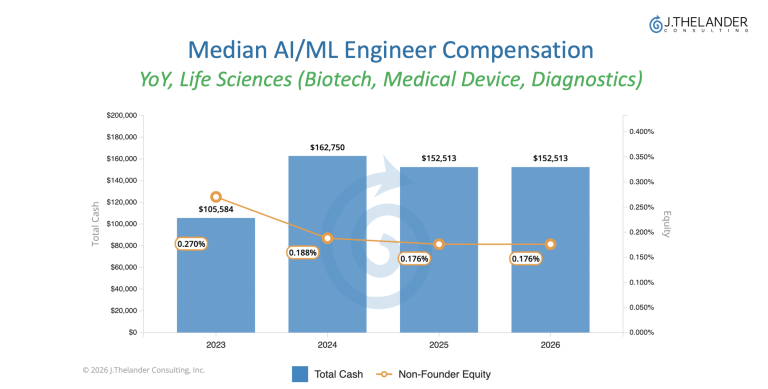
In Carta‘s State of Startup Compensation Report, they said that “the dominance of AI is shaping how founders build and compensate their teams.” AI equity compensation is rising — but is it rising equally across every industry? In Michael Bodley‘s article digging into the report, he noted that initial equity grants for individual contributors on Carta have grown by nearly 11% over the past two years, while median salaries rose 6.4%. That motivated us to look at our own life science and tech data to see if the AI equity premium was hitting every industry the same way. And it’s

Read More »

The Investor Option Pool: Why Valuation Matters More Than Share Size

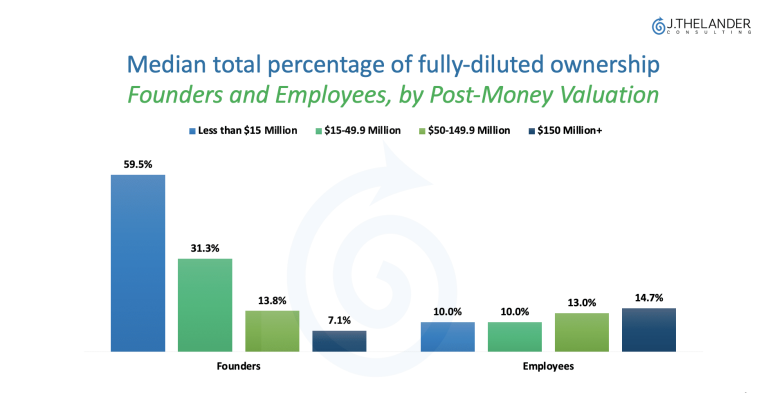
In our last piece, we looked at how the founder share of a company’s option pool shrinks as valuations rise — and what that actually means in dollar terms. This week, we’re looking at the investor option pool: what that growth actually means, and why the dynamics of the investor pool are fundamentally different from those of the founder pool. The investor option pool behaves differently from the founder pool. For founders, the relative size of the option pool matters significantly. A founder at the 75th percentile in a lower valuation tier can end up with more in dollar terms

Read More »

The Option Pool Paradox: Why Higher Valuations Don’t Always Pay Off

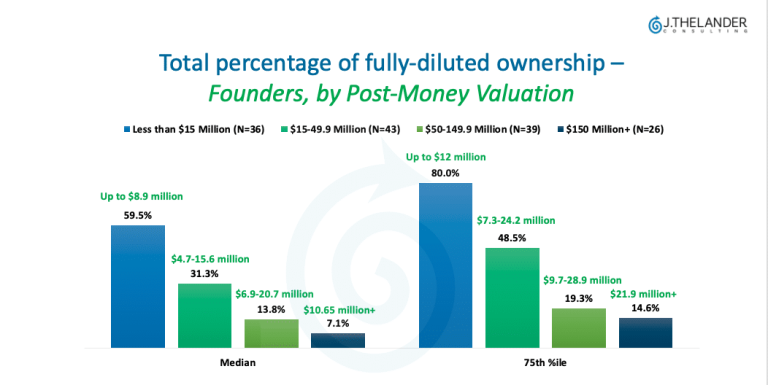
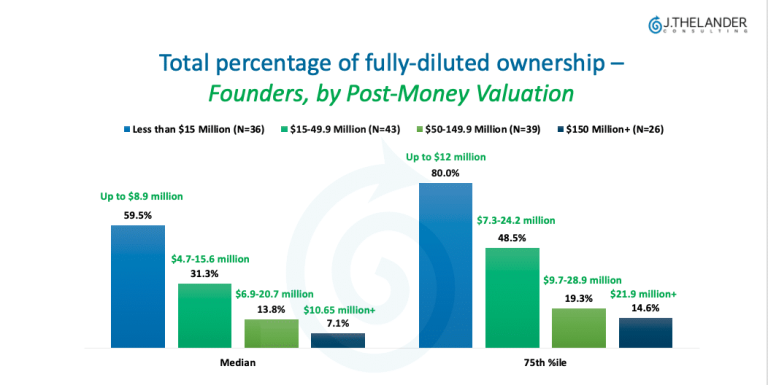
We’re taking last week’s analysis one step further: what do those different option pool sizes actually mean in dollar terms? The short answer is that a higher valuation doesn’t automatically translate into a better outcome for founders. A smaller slice of a bigger pie can — and sometimes does — mean less money in your pocket. Using the chart above from the Thelander Option Pool Report (available on the Thelander Platform), we looked at the median and 75th percentile of total percentage of fully-diluted ownership for founder across valuation tiers, then multiplied those percentages by the corresponding valuation ranges to

Read More »

Startup Option Pool by Valuation: How Pools Shift as Companies Grow

With the slew of new data that came out of the PitchBook-NVCA Venture Monitor r this week, startup option pool by valuation has been on our mind. So, we dug into the Thelander Option Pool Report (available on the Thelander Platform) to see how rising valuations changed the makeup of the option pool between founders, employees and investors (that data drop is coming tomorrow). Valuations are rising, especially for top-tier startups, but it’s important for companies at all levels to understand how valuation relates to compensation. Valuations primarily affect compensation by determining the value of the shares held by founders

Read More »

Venture Capital Compensation Trends: Roles Funds Are Betting On

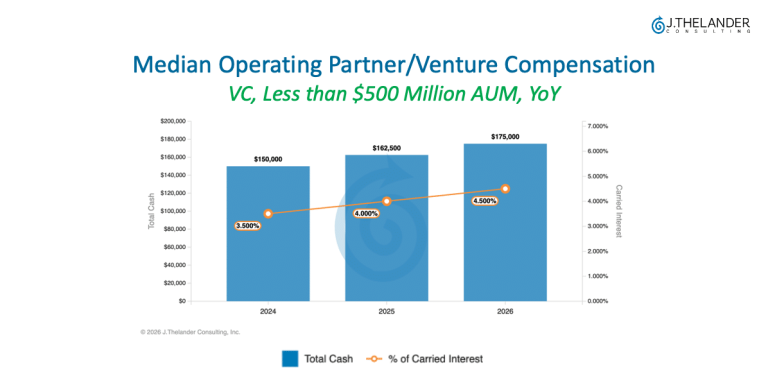
When we asked Perplexity what was going on in Venture Capital this week, it said that venture was in its “value creation” era — and when we looked at the year-over-year venture capital compensation trends on the Thelander platform, we understood why. We pulled the roles with the biggest jumps in median total cash since 2024, and a clear pattern emerged: funds are paying up for people who move the needle for the fund and founders. At VC firms with less than $500M in total AUM, Operating Partners and Directors/Principals are tied for the largest gains, each up around 17%.
Read More »

Private Company Non-Investor Board Member Compensation Data

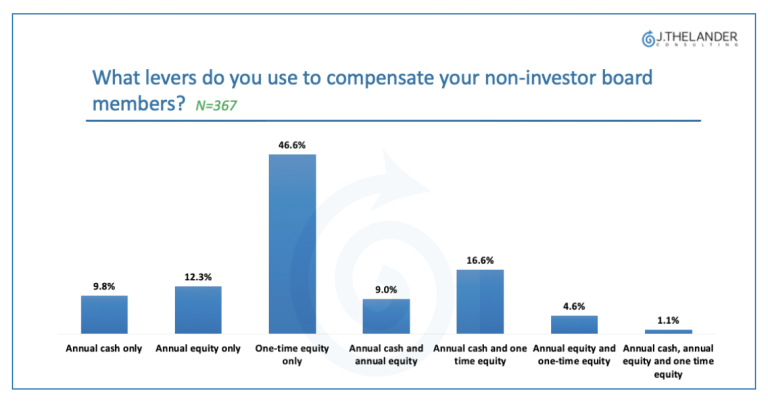
Independent board members bring industry expertise and valuable networks to the table — and attracting the right ones means knowing what the market pays. So, how does private company non-investor board member compensation actually work? Is it a mix of cash and equity? According to Thelander, yes. And does it change as companies grow? Again, yes. Significantly. What the Data Is Actually Saying The overall picture:  The financing stage story is where it gets really interesting: The through line: As companies raise more capital, they shift from pure one-time equity toward cash and equity combinations. The board formalizes compensation in lock-step

Read More »

Startup Compensation Strategy: A 4-Step Roadmap From Ad Hoc Offers to Defined Bands

Every founder eventually asks the same question about their startup compensation strategy: “Do I need a real compensation strategy or can I wing it?” Here’s a 4-step roadmap for when and how to move from ad hoc offers to defined bands and levels. 1. What is a “real” compensation infrastructure? A compensation infrastructure means building clear job architecture and pay structures across your company. It includes defined levels for scientific, technical and administrative roles (from entry level to director), with cash and equity bands tied to market data. It also means moving away from ad hoc decisions based on what

Read More »

What’s the Difference Between Founder Shares and Founder Shares for Current Job at a Startup?

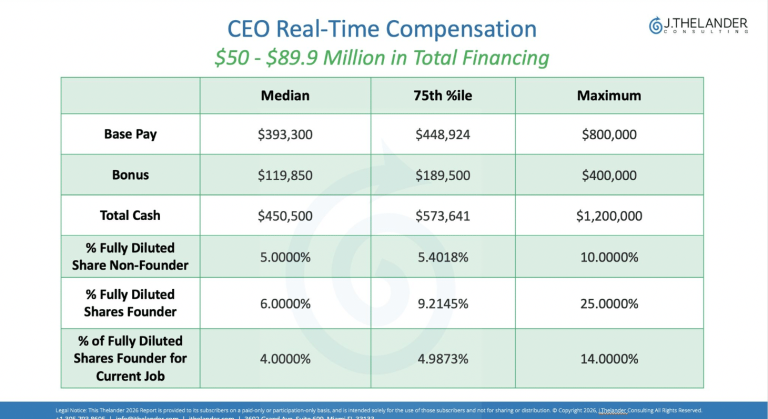
One of our most frequently asked questions is about founder shares — specifically, what’s the difference between founder shares and equity granted for current job?In this week’s PC Data Drop, we’re giving you the answer using a real-time CEO data table pulled directly from the Thelander platform — filtered for companies with $50M–$89.9M in total financing. — % Fully Diluted Share Non-Founder: The percent of fully diluted shares granted to a non-founder CEO as part of their total compensation package. The median here is 5.0%.— % Fully Diluted Shares Founder: Percent of fully diluted shares awarded for being a founder. The median is 6.0%.— %

Read More »

Bonus Structures: VC Holds Steady While PE Drifts Toward Discretion

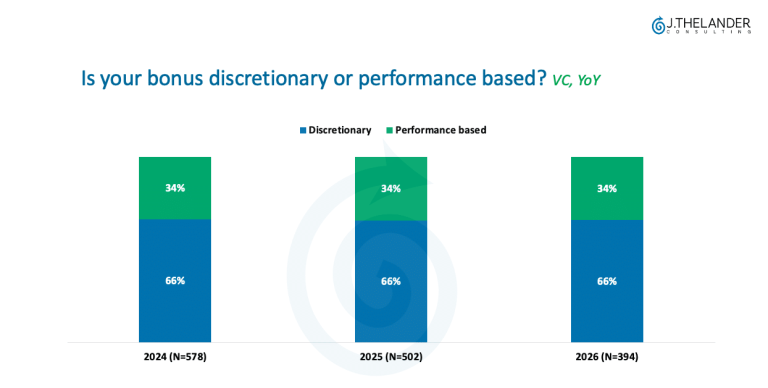
What’s driving VC and PE bonus structures in 2026? New data from the Thelander x PitchBook Investment Firm Compensation Survey shows that bonus structures across VC and PE firms remain tilted toward discretionary pay — but the similarity ends there.  The Wall Street Journal reported this morning that Wall Street’s 2025 bonuses reflect a “gangbusters” year – payouts largely based on “teams’ and firms’ performance.” It’s a timely backdrop for what Thelander data shows happening inside VC and PE firms, where the question of how bonuses are determined tells a more nuanced story. Bonuses can be determined in one of two ways:— Discretionary, meaning entirely

Read More »

VC Associate Compensation by Region: Why AUM Matters More Than Geography

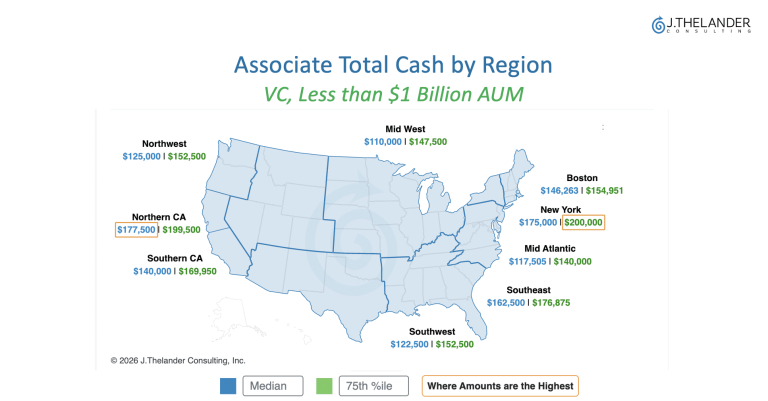
VC associate compensation by region varies widely across the U.S., but the biggest driver of total cash might not be what you’d expect. While associates in Tier 1 regions do earn more, the most significant step-up in total cash occurs once firms cross the $1 billion AUM threshold. Using the interactive compensation maps from the Thelander platform, here’s what the data shows. Under $1 Billion AUM: Geography Leads The spread here is wide—median associate total cash ranges from roughly $110,000 in the lowest region to nearly $180,000 in the highest. $1 Billion+ AUM: Geography Compresses The Bottom Line: Firms pay

Read More »

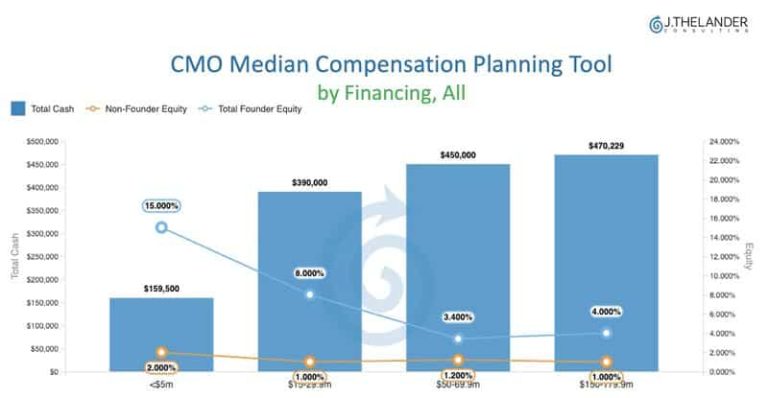
CMO Compensation at Private Companies: What It Takes to Land a Top Chief Medical Officer

CMO compensation at private companies is climbing as the role becomes one of the most competitive executive searches in life science. What’s a trending role for private life science companies right now? CMOs. Last week, we hosted a Lunch & Learn webinar (video below) with Cissy Young, PhD (楊 詩華), Managing Director True Search, and she shared why CMOs have become one of the hottest executive searches for private companies. “Financing is starting to come back, but the investors are very disciplined and they expect that the entrepreneurs are going to be disciplined.” If you’re going to spend the money
Read More »

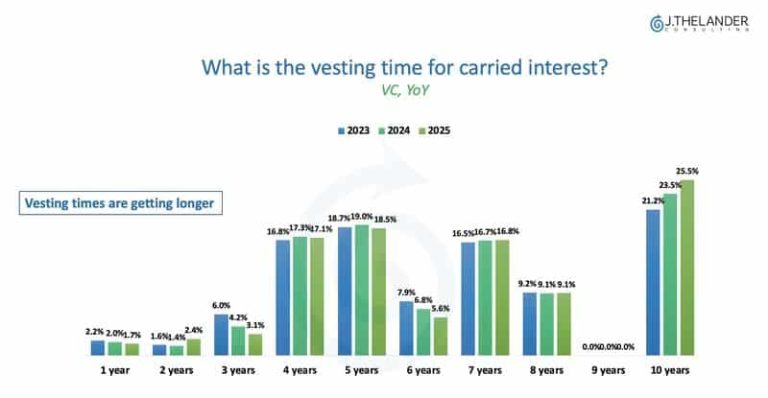
Carried Interest Vesting: How VC and PE Firms Are Moving in Opposite Directions

Carried interest vesting is diverging — and the gap between VC and PE is widening. Using carried interest data from the Thelander platform, we’re seeing a clear split in how both VC and PE firms are structuring vesting times. At Venture Capital firms, vesting is getting longer. At Private Equity firms, vesting is getting shorter. The takeaway: With both fundraising and exits taking longer, venture firms are using longer vesting to reinforce long term alignment. Private equity firms are concentrating economics over a tighter window — making it more important than ever to benchmark your carried interest percentages to market.

Read More »

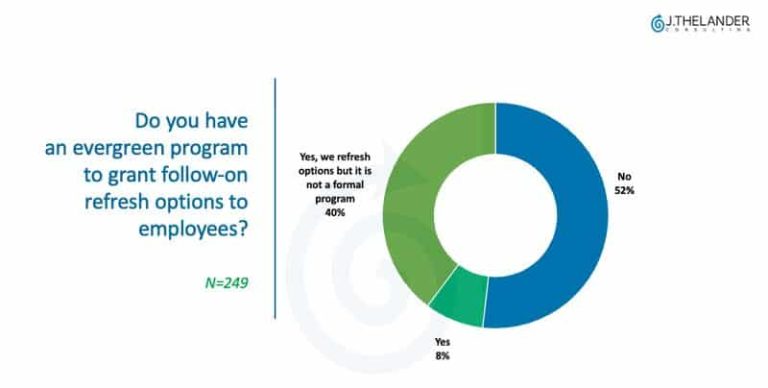
Equity Refresh Grants: When and How Often to Refresh Options

Equity is one of the most powerful compensation levers available to privately held companies AKA startups. We get asked weekly: How do equity refreshes work? In this week’s PC data drop, we’re breaking down what equity refresh grants are, when companies actually use them, and how to make them sustainable and strategic. All data is pulled from the Thelander Platform, via a Private Company Subscription. Equity refresh grants are follow-on equity awards for existing employees whose original grants are fully vested. They’re designed to keep key employees incentivized and aligned as the company grows. Here’s what you need to know:

Read More »

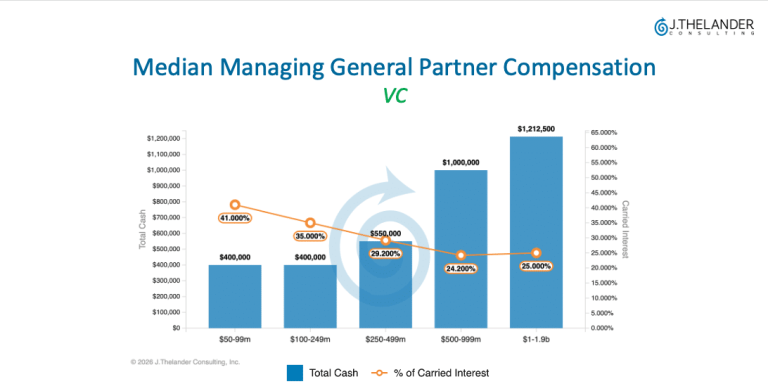
How Managing General Partner Compensation Changes as AUM Grows at VC Firms

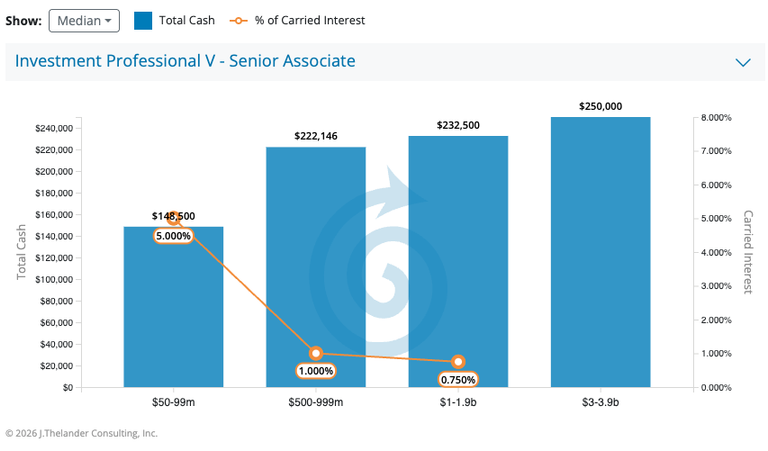
You’re a Managing General Partner of a venture firm and your AUM grows from $50 – $99 million to $1 – $1.9 billion…How do you expect the mix of cash and carry to change? The Thelander Comp Planning tool has the answer. Using real-time data from the Thelander platform: Thousands of firms rely on the Thelander Comp Planning Tool to model the evolution of their own firm to understand exactly how much cash and carry to allocate to their teams. To see how your current mix of cash and carry compare to market for no charge, fill out the Thelander x

Read More »

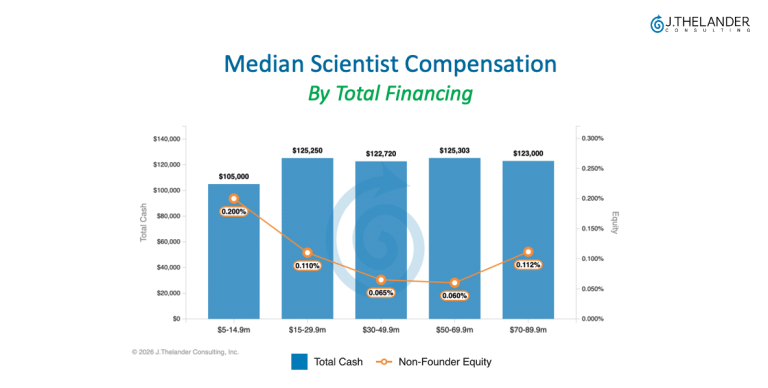
Scientist Compensation at Private Companies: How Cash and Equity Shift by Funding Stage

Scientist compensation at private companies doesn’t just rise with each funding round—the balance between cash and equity can flip as companies grow. As private companies raise more capital, the mix shifts: cash is more available and equity is more of a commodity. Using real-time data from the Thelander Comp Planning Tool, here’s how scientist total cash and non-founder equity move across financing bands. The Thelander platform provides real‑time compensation data on 300+ roles—from the C‑suite to entry‑level employees. To see how your current compensation compares to market, participate in the no-charge Thelander Private Company Compensation Survey today. You’ll unlock data for all

Read More »

How CVC Unit Leader Compensation Has Changed Since 2022

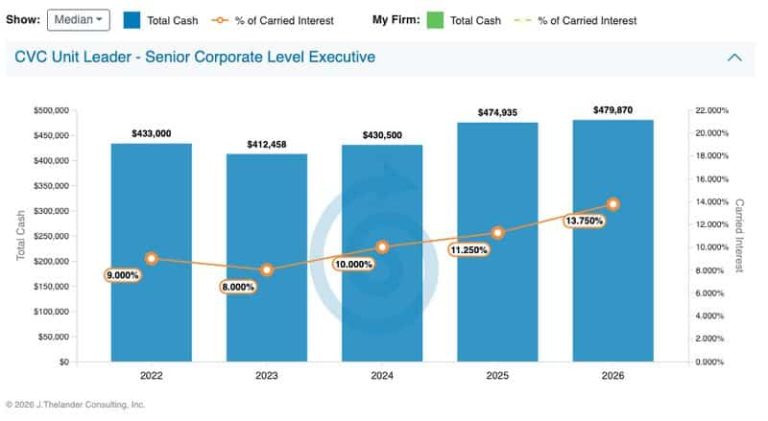
CVC Unit Leader compensation has grown meaningfully over the past five years, with the sharpest gains showing up in carried interest. Using data from the Thelander platform, this data drop tracks how total cash and carried interest for CVC Unit Leaders—senior corporate-level executives running corporate venture units—have shifted from 2022 through 2026, at both the median and 75th percentile. Carried Interest: The Standout Story The most striking change is in carry. Total Cash: Steady Growth Total cash has risen more modestly. The bottom line? The professionalization of CVC Units has come with rising compensation across both total cash and carried

Read More »

How Private Tech CEO Compensation Changes by Revenue

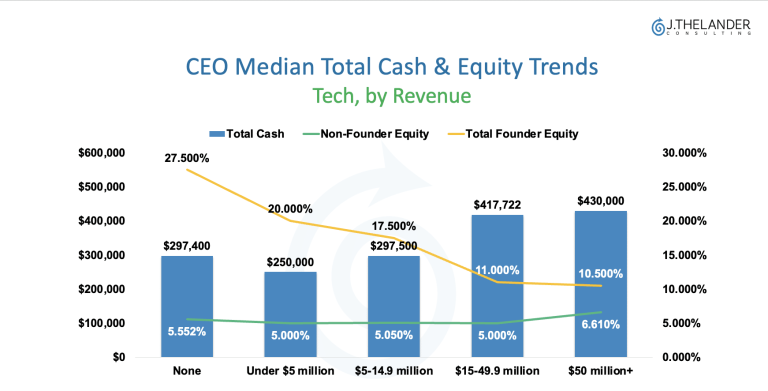
In this week’s PC data drop, we’re using data from the Thelander Platform looking at how median total cash, founder and non-founder equity compensation for CEOs of private tech companies shifts based on revenue. Generally speaking, the more revenue a company generates, the higher the CEOs median total cash compensation. As far as total founder equity goes, the typical dilution still occurs. Total Cash Rises With Revenue Founder Equity Dilutes as Companies Scale The equity story runs in the opposite direction. Non-Founder Equity Holds Steady What This Means for Compensation Planning Revenue is a meaningful benchmark for CEO compensation, but

Read More »

How Long Until You Get Promoted? Career Progression at Investment Firms

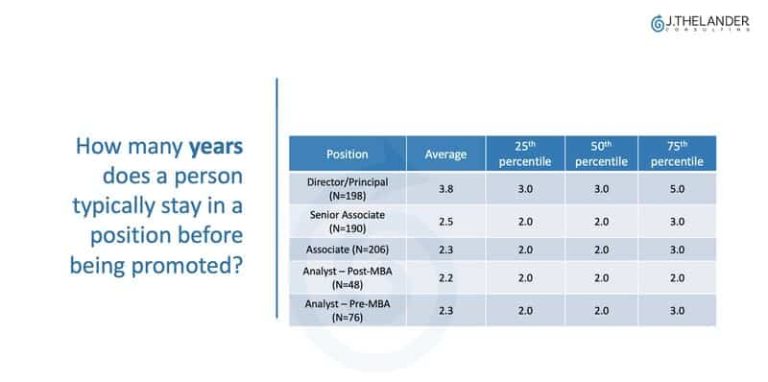
The promotion timeline at investment firms varies by level, but the data reveals a clear pattern: the higher you climb, the longer it takes to move up. Using data from the Thelander platform across 500+ investment firms, here’s how long professionals typically spend in each role before their next promotion. Using data from the Thelander platform from 500+ investment firms: Both pre-MBA and post-MBA analysts move up in roughly two years on average (2.3 and 2.2 years, respectively). At this early stage, progression is relatively quick and consistent—the median time in role is 2 years, with the top quartile moving

Read More »

How Startup Executive Compensation Has Changed Since 2021

Using the Thelander YoY private company dataset, we looked to see which private company executives have seen the biggest movement in total cash since 2021. For startups with $50–$109.9M in total financing: In other words, CSOs have quietly seen some of the strongest total cash growth in this funding band—especially at the top end of the market. Curious to see how your current comp compares to real-time market data? Fill out the Thelander Private Company Compensation Survey today to find out ➡️ survey.jthelander.com

Read More »

Compensation Infrastructure for Startups: How Pay Plans Evolve as You Raise Capital

Building compensation infrastructure for startups is one of the most overlooked foundations of a growing company—but what does putting it in place really mean? It means building a clear job architecture and a structured salary framework. It also means moving away from ad-hoc decisions—whether driven by what an individual candidate asks for or by setting pay position by position—because those one-off choices tend to create problems down the road. It’s never too early to put this infrastructure in place. The sooner you do, the stronger your foundation will be. That way, you and your team can spend less time wondering

Read More »

What Startups Need to Know Re: Secondary Markets & Compensation

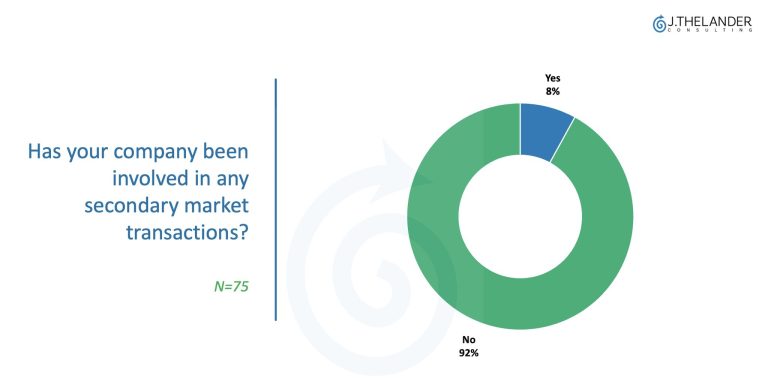
Thelander recently published the results from the Private Company Year-End Merit Increase, Option Pool & Bonus Report (available through a subscription to the Thelander Platform) – which featured new data on secondary markets given their prominence in today’s global private capital market. Here’s what startups need to know re: secondary markets and compensation. The results? 92% of private companies surveyed haven’t engaged in any secondary market transactions. Out of the 8% who have engaged in these transactions: And do the companies assist employees in financing a liquidity solution? Short answer, NO. As companies stay private for longer and “secondaries have gained acceptance as a critical liquidity

Read More »

What Are Director of Investor Relations Making at Investment Firms?

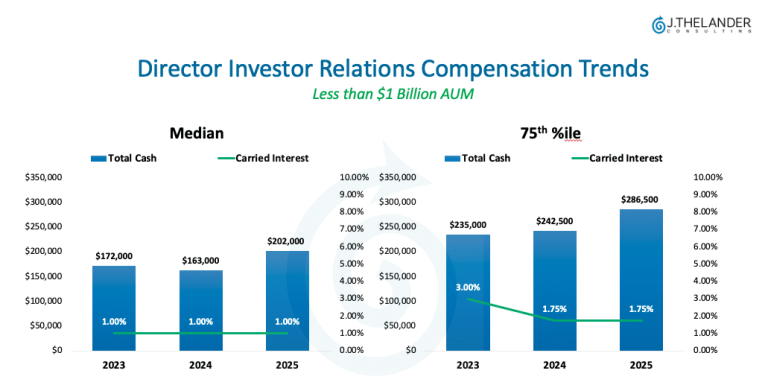
Investor relations has become a strategic role at investment firms, and Director of Investor Relations compensation is starting to reflect it. As fundraising and exits take longer, Directors of IR sit at the intersection of capital raising, LP communication and firm reputation. So, does the compensation data reflect that growing responsibility? At firms with less than $1 Billion in total AUM – At firms with more than $1 Billion AUM, total cash decreased at both the median and 75th. What’s the bottom line? At firms under $1 Billion AUM, total cash for Directors of IR is climbing—up $30,000 at the

Read More »

What do CFOs at private companies make?

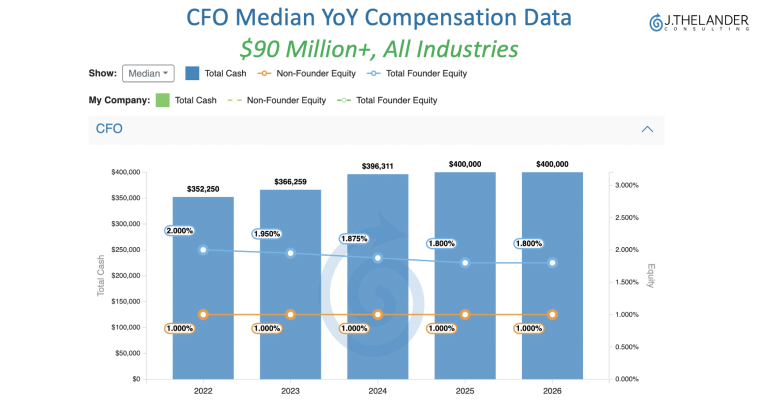
CFOs are invaluable at private companies (AKA startups) —often seen as the #2 alongside the CEO. At later‑stage private companies, the CFO isn’t just running finance; they’re co‑piloting the business and owning the path to liquidity (which is opening back up). So, what are these key players making? Using YoY data from the Thelander platform (available through a subscription or survey participation), median CFO total cash has risen from $352K in 2022 to $400K in 2025–26 for companies that have raised $90M+. If you’re a CFO or private company exec planning key 2026 hires, you can access real‑time compensation data for every

Read More »

Family Office vs. Venture Capital Firms: Who Pays More?

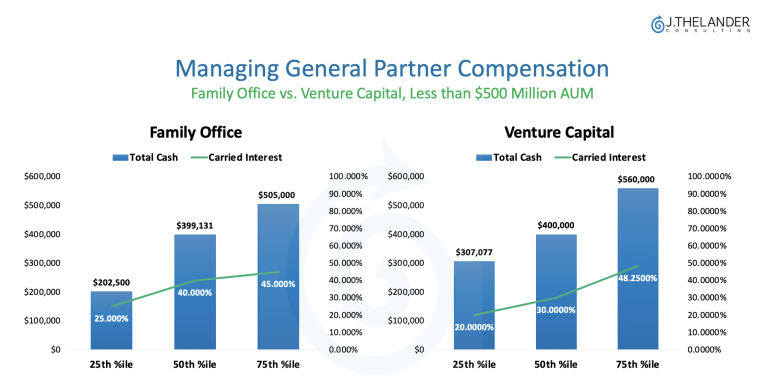
When it comes to family office vs venture capital compensation, there’s no single answer to who pays more, it depends entirely on the role, the percentile you’re using and the total AUM. This week’s investment firm data drop analyzes total cash and carried interest compensation for Managing General Partners and Director / Principal level roles at family offices and venture capital firms with less than $500 million in total AUM.  Key takeaways: Managing General Partner Key Takeaways: Director / Principal It’s all about the competition for talent. Family offices may offer lower cash at entry levels but provide stronger carried interest opportunities—particularly for Director/Principal talent.

Read More »

Startup Compensation Trends: Five Straight Years of Total Cash Growth

Startup compensation trends continued their upward climb in 2025. This data drop analyzes total cash compensation trends across four key positions – CEOs, CSOs, Engineering Managers and Operation Managers – at startups that have raised between $50 and $109.9 million in total financing. Thelander data shows that total cash increased in 2025 for all four positions at both the median and 75th percentile. It continues the overall trend of increasing total cash since 2021.  Key Findings for YoY Growth (2024 to 2025):  At the median, Operations Managers saw the highest percentage of growth from 2024 to 2025 – 16% – outpacing higher-level positions which

Read More »