
QSBS Eligibility: How Investment Firms Track It
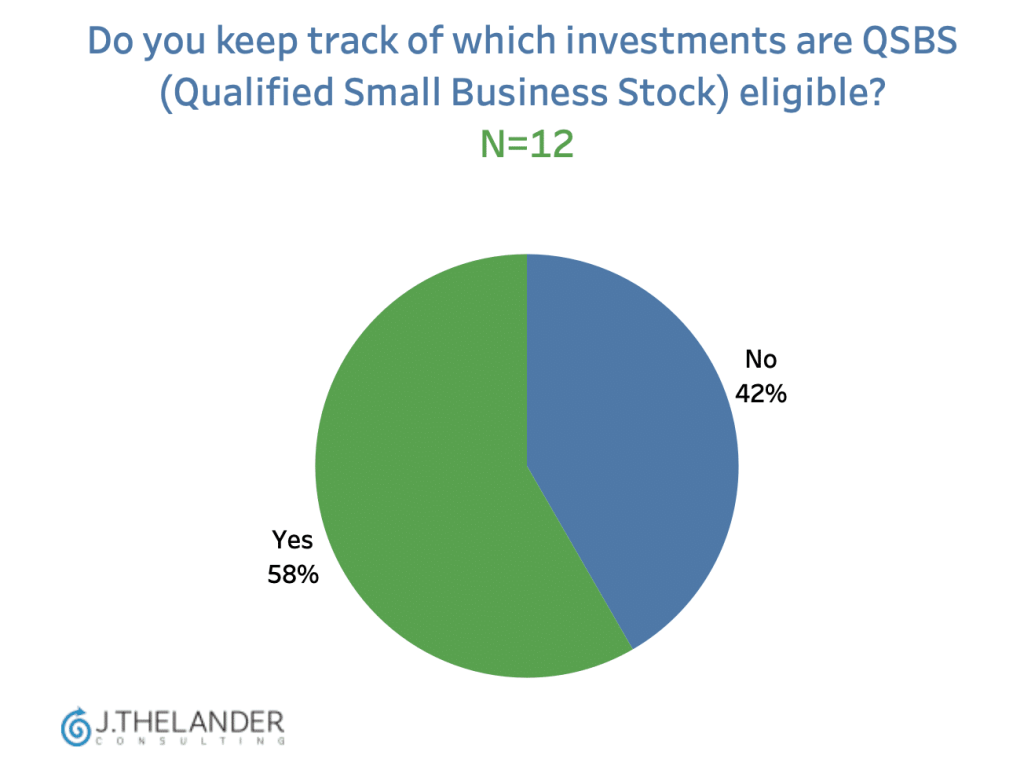
Carried Interest & Management Fees Report Have you participated in the Thelander-PitchBook Investment Firm Compensation Survey yet? Secure your complimentary Carried Interest & Management Fees Report when you complete your response by August 17th. Click here to participate. Exclusive Preview From the 2026 Report So far, more than half of respondents keep track of which investments […]
Where Talent is Moving Across VC & PE
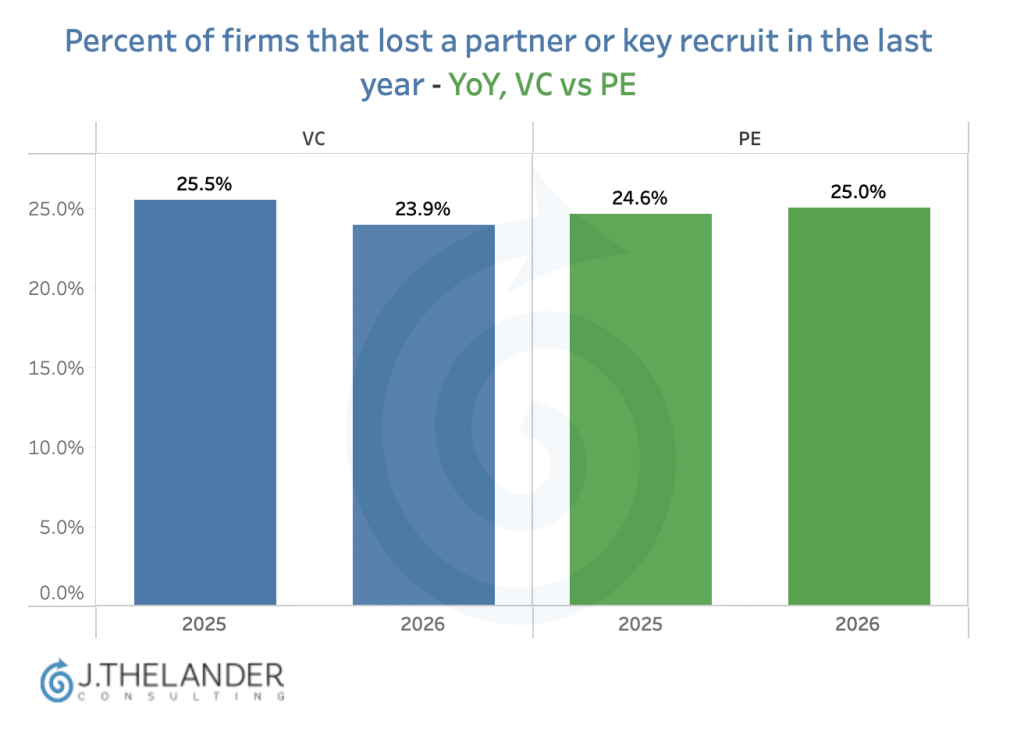
According to the Q2 PitchBook-NVCA Venture Monitor, “LP dollars are still flowing, but they are reaching a smaller set of large established managers rather than the broader market.” On the other hand, venture dollars continued to flow “unevenly” and megadeals made up 87.5% of the $412.7 billion deployed. So, how does this translate to talent and […]
Long Term Incentives at CVC Units
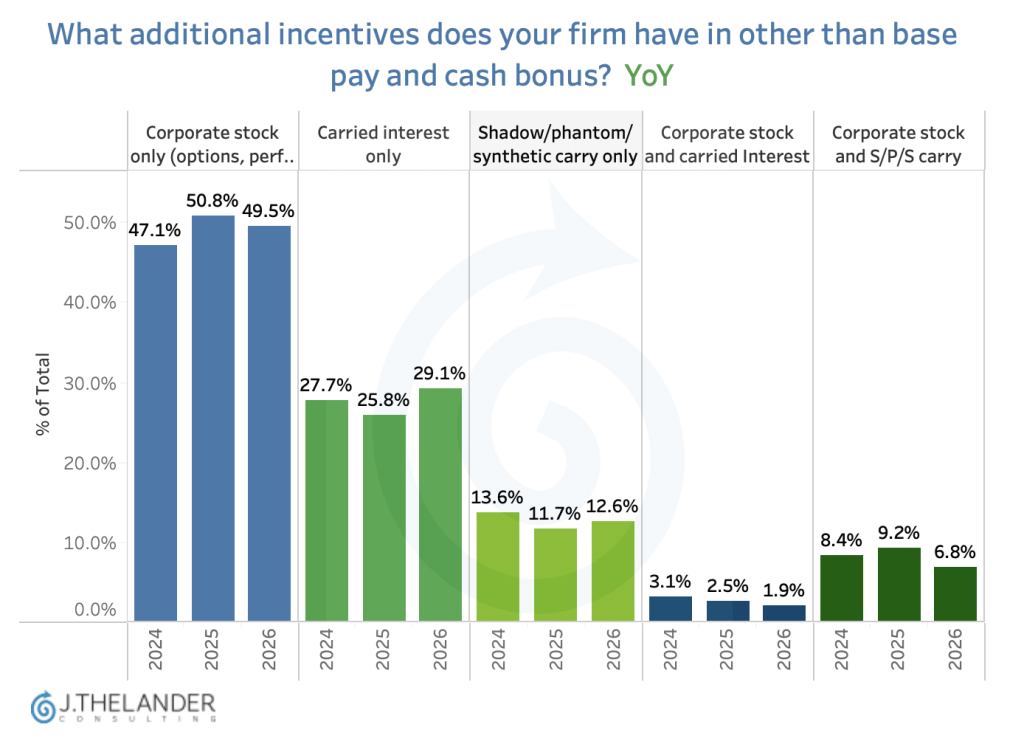
In this month’s CVC Digest, we are revisiting one of our most popular newsletters to see how the data has changed. The Three Year Shift in Long Term Incentives Over the past three years: Does incentive structure impact median total cash for CVC Unit Leaders? What additional incentives are used also impacts how much cash an […]
What Private Companies Pay Engineers: Engineering Pay in 4 Charts
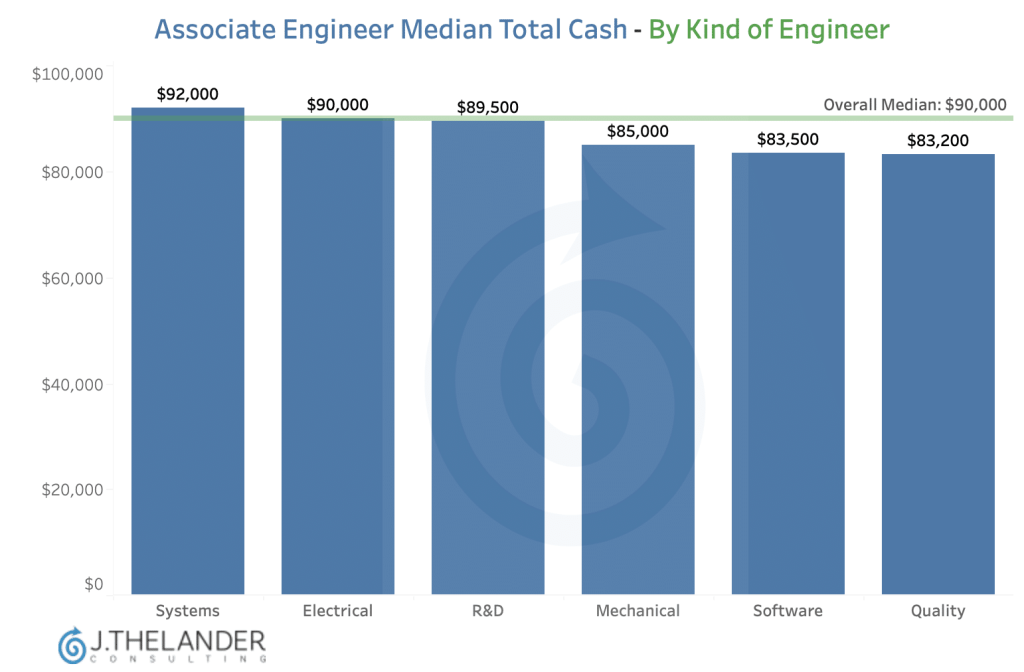
In the first half of this year, we’ve covered AI/ML Pay Premiums & Salary Structures for Engineers, but this month we’re looking at how different types of engineers are paid at private companies… and how the compensation shifts as they move up the career ladder. We’re digging into six different job families – software, systems, electrical, mechanical, quality and […]
Biotech CEO Compensation: The Real Inflection Point
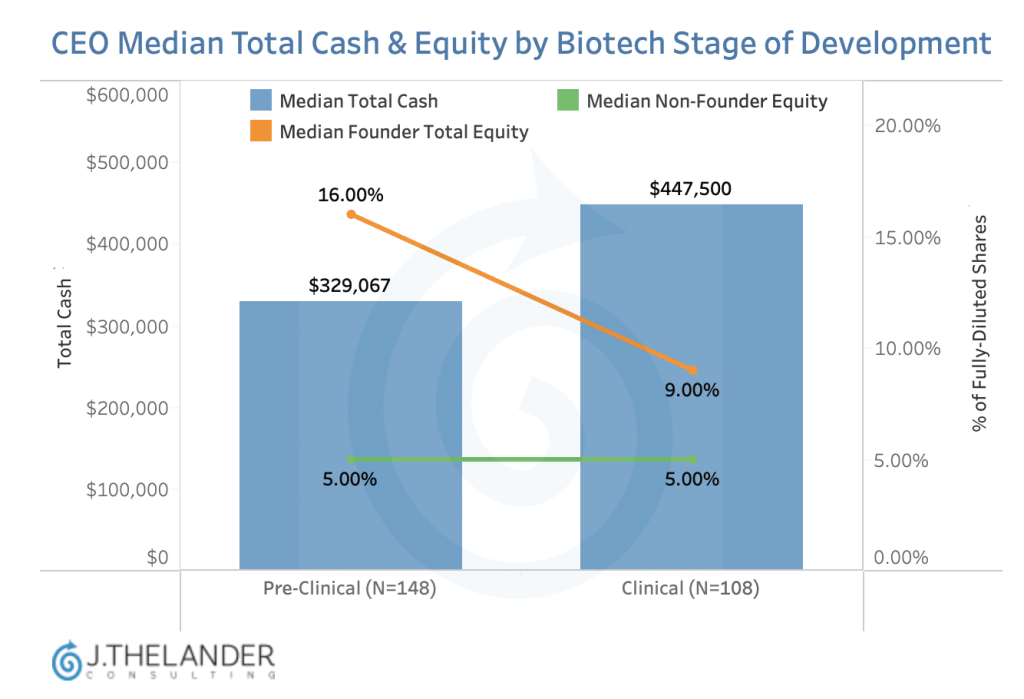
The real inflection point in biotech CEO compensation isn’t between early and late clinical trials. It’s the leap from pre-clinical to clinical. In this data drop, pulled directly from the Thelander Platform, we looked at how median total cash, founder and non-founder equity changes across biotech stages of development. Pre-Clinical → ClinicalMedian total cash: $329,067 […]
AI in Venture Capital and Private Equity: How Firms Differ
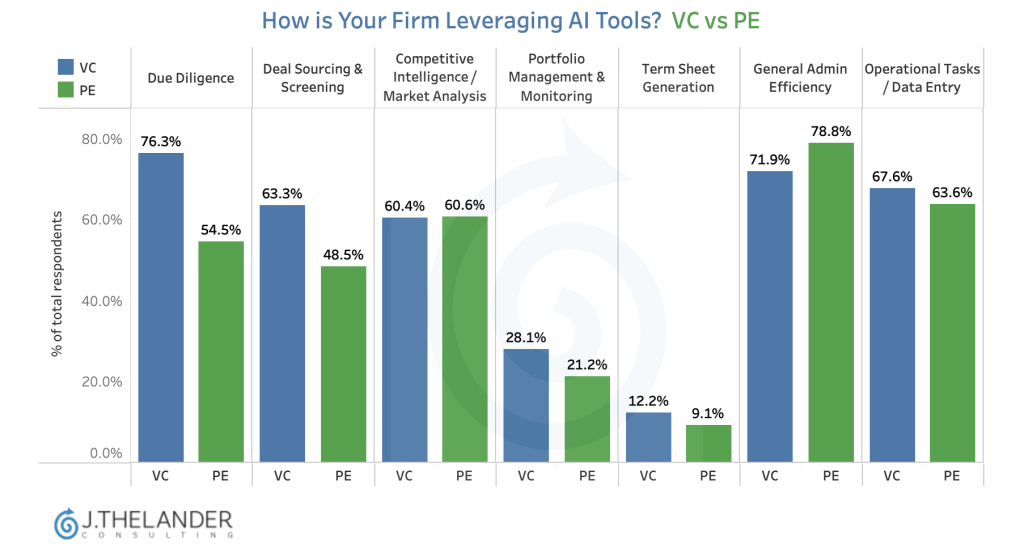
Using data from the Thelander AI in VC report (available on the Thelander Platform for no charge), we looked at how AI in venture capital and private equity is being used in very different ways — and the data shows a clean split by firm type. VC firms are more likely to use AI for […]
Venture Capital Compensation by Role: What the Data Actually Shows
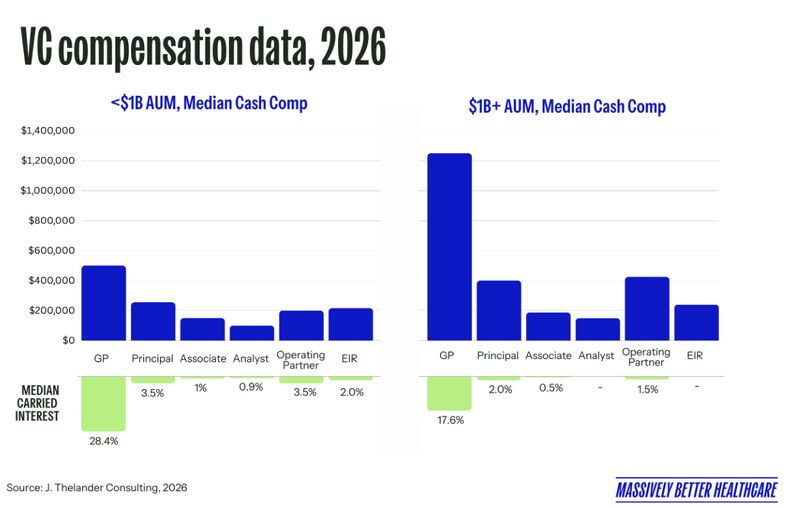
Any day Thelander data is used in a Halle Tecco, MPH, MBA blog post is a good day. Halle updated her post on “The Many Roles at a Venture Fund — And How to Land Them” with real-time (& exclusive) compensation data from the Thelander platform for six job titles. We customized the data by […]
Investment Firm Compensation: What Associates and Managing Directors Are Making
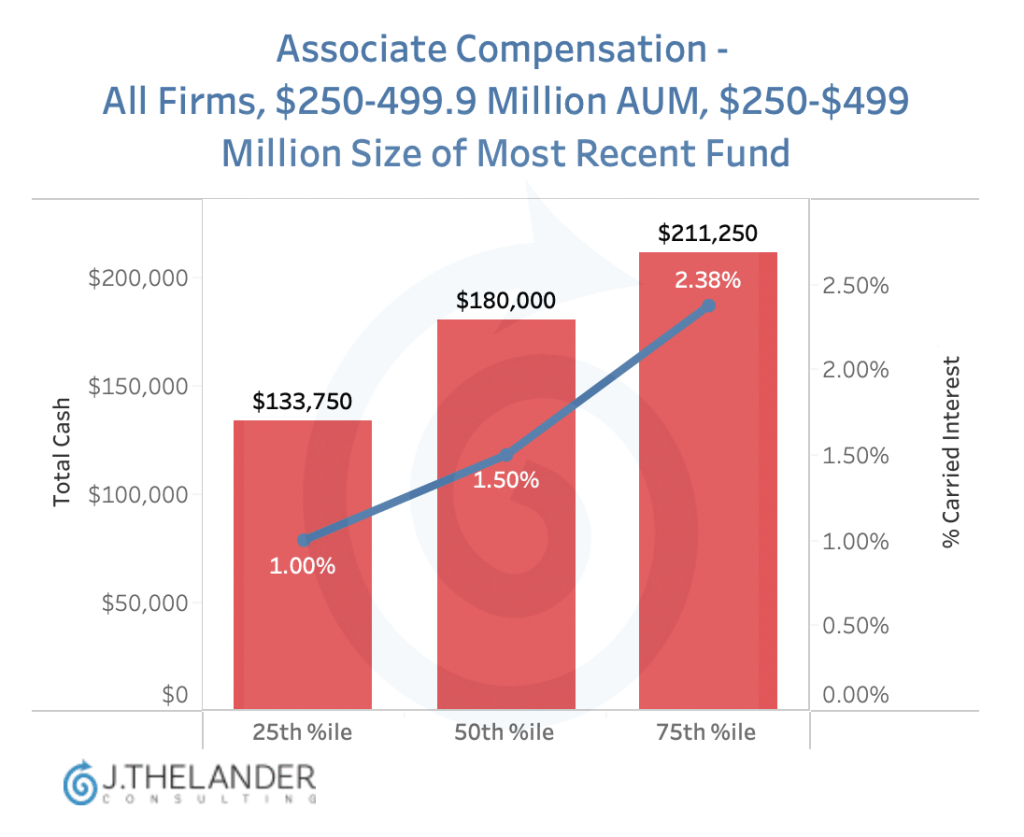
In honor of America’s 250th birthday, we’re sharing real-time comp data (straight from the Thelander platform) for all investment firms with $250 – $499M AUM and a most recent fund of $250 – $499M. Here’s what Associates & Managing Directors / Partners are making: Chart #1: AssociatesTotal cash ranges from $133,750 at the 25th percentile […]
Marketing & Communications Roles at Investment Firms. How’s the Comp?
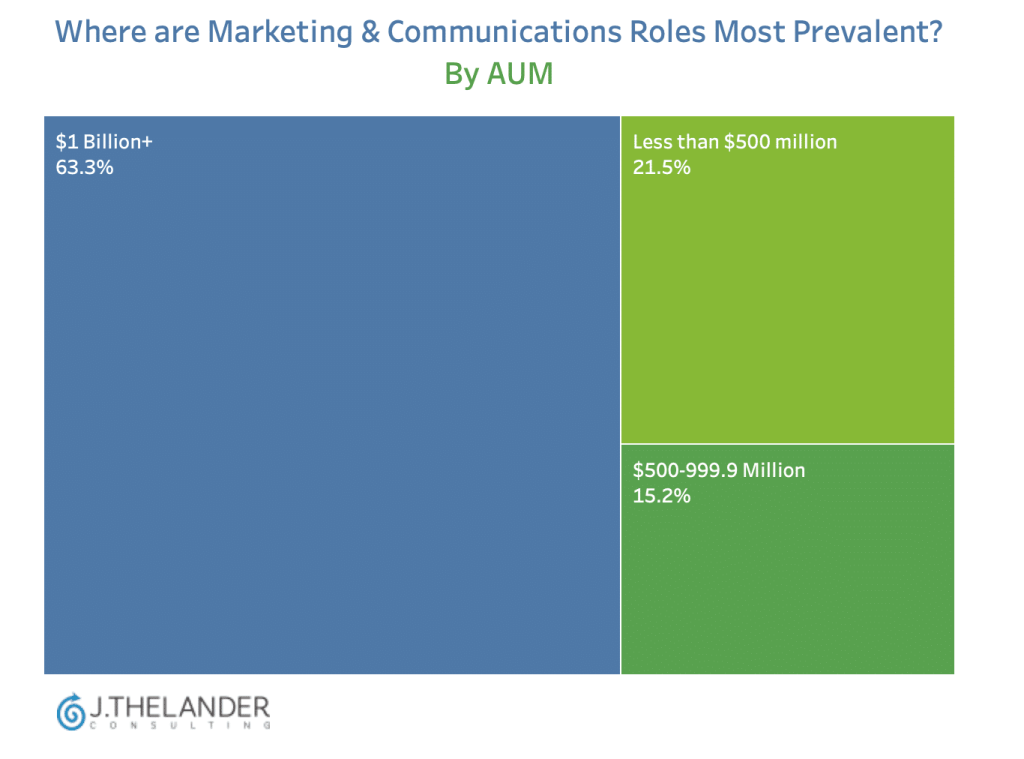
Dedicated in-house marketing teams at investment firms is still relatively rare, but that’s changing. Firms like Lightspeed are leading the shift, with their CMO describing the firm as “much more than capital providers. They’ve become media companies.” How common are dedicated Marketing & Communications roles across the broader investment firm ecosystem, and what does it take for […]
How Private Company Fundraising Has Changed in 5 Charts
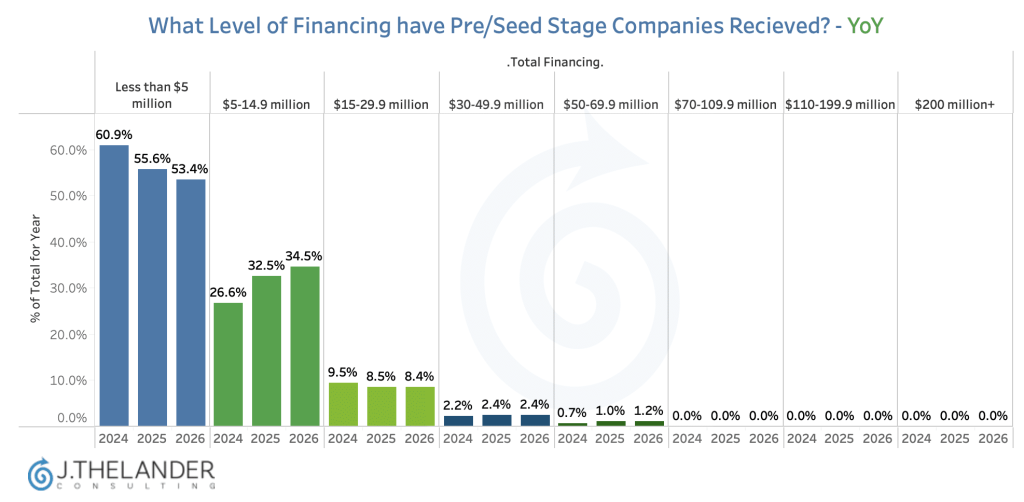
Fundraising rounds at private companies are getting larger at every stage. In this month’s digest, we are digging into the correlation between the most recent series raised and the total amount of financing raised (as a dollar amount) to see how the market has shifted since 2024. That shift has meaningful implications for how companies […]